Laske sitoutumiskorkosi
Syötä Instagram-metrisi. Saat sitoutumiskorkosi ja näet, miten vertaudut.
Alan vertailuarvot
Keskimääräiset Instagram-sitoutumiskorot seuraajamäärän mukaan (2026 tiedot).
| Luokka | Seuraajat | Kesk. sitoutumiskorko |
|---|---|---|
| Nano | 1K - 10K | 4% - 6% |
| Micro | 10K - 50K | 2% - 4% |
| Mid-tier | 50K - 500K | 1% - 2.5% |
| Macro | 500K - 1M | 0.8% - 1.5% |
| Mega | 1M+ | 0.5% - 1% |
Mikä on Instagram-sitoutumiskorko?
Instagram-sitoutumiskorko mittaa, kuinka aktiivisesti yleisösi vuorovaikuttaa sisältösi kanssa suhteessa seuraajamäärääsi. Se ottaa huomioon tykkäykset, kommentit, jaot ja tallennukset - neljä pääasiallista sitoutumissignaalia, joita Instagramin algoritmi käyttää sisällön laadun ja tavoittavuuden määrittämiseen.
Korkeampi sitoutumiskorko osoittaa, että sisältösi resonoi yleisösi kanssa ja että seuraajasi ovat aidosti kiinnostuneita siitä, mitä julkaiset. Brändit ja markkinoijat käyttävät sitoutumiskorkoa keskeisenä mittarina arvioidessaan vaikuttajayhteistyöitä ja sisältöstrategian tehokkuutta.
Kuinka laskea sitoutumisaste
Instagramin sitoutumisasteen standardikaava on:
Sitoutumisaste = ((Tykkäykset + Kommentit + Jako + Tallennukset) / Seuraajat) x 100
Tarkimman tuloksen saamiseksi käytä keskiarvoja viimeisistä 10-12 postauksestasi yhden sijaan. Tämä tasoittaa poikkeamia - viraalista postausta tai huonosti suoriutuvaa - ja antaa luotettavan perustan.
Jotkut markkinoijat laskevat sitoutumisen kattavuuden mukaan (näyttökertojen perusteella) sen sijaan, että laskisivat sen seuraajien mukaan. Seuraajapohjainen menetelmä on yleisemmin käytössä, koska seuraajamäärä on julkisesti näkyvissä, mikä helpottaa vertailua eri tileillä.
Vinkkejä sitoutumisasteen parantamiseen
Julkaise, kun yleisösi on aktiivinen
Tarkista Instagram Insightsista, milloin seuraajasi ovat online. Julkaiseminen huipputunneilla lisää alkuperäistä sitoutumista, mikä signaaloi algoritmille, että sisältösi pitäisi näkyä useammalle ihmiselle.
Käytä vahvoja toimintakehotuksia
Esitä kysymyksiä, luo kyselyitä ja kannusta tallennuksiin. Postaukset, jotka kehottavat tiettyyn toimintaan, ylittävät jatkuvasti passiivisen sisällön.
Luo tallennettavaa sisältöä
Infografiikat, opetusohjelmat ja viiteoppaat saavat paljon tallennuksia. Tallennukset ovat voimakas sitoutumissignaali, joka lisää algoritmista kattavuutta.
Vastaa jokaiseen kommenttiin
Kommentteihin vastaaminen kannustaa lisää vuorovaikutusta ja kaksinkertaistaa kommenttimääräsi. Se myös rakentaa yhteisön uskollisuutta.
K�äytä karusellipostauksia
Karusellit tuottavat korkeampaa sitoutumista kuin yksittäiset kuvat, koska ne kannustavat pyyhkäisyyn, mikä lasketaan vuorovaikutukseksi ja lisää aikaa, joka vietetään postauksessasi.
Kirjoita pidempiä kuvatekstejä
Yksityiskohtaiset kuvatekstit lisäävät aikaa postauksessa ja kannustavat kommentteihin. Tavoittele 100-200 sanaa, jossa on koukku ensimmäisessä lauseessa.
Instagram Engagement Rate by Industry (2026)
The tier table above tells you what a 50K follower account "should" do on average. But average across industries hides a 4x spread. A 2.1% engagement rate is excellent for a fashion brand at that tier and a disaster for a B2B SaaS account at that tier. Niche context matters more than people admit.
These are the engagement rate bands we see in the wild for accounts in the 10K-100K tier, based on a rolling sample of the accounts our users analyze every week.
- Beauty and fashion: 1.5% - 3.2%. Lower than people expect because the audience is enormous and aspirational. Saves matter more than likes here.
- Fitness and wellness: 2.0% - 4.0%. Driven by save-heavy workout content and a tight, returning audience.
- Food and recipe: 2.5% - 4.5%. Highest save rates on the platform. Reels with on-screen recipe cards regularly clear 6%.
- B2B SaaS: 0.6% - 1.4%. Small but high-intent. Treat clicks-to-website as a more honest signal than likes here.
- Coaches and online education: 1.8% - 3.5%. Comments dominate over likes - quality of comment thread matters more than raw rate.
- Travel: 1.8% - 3.0%. Visual but passive. Saves on guides outperform likes on landscapes.
- Finance, investing, crypto: 1.2% - 2.5%. Volatile. A single market-moving post can 10x the weekly rate.
- Real estate and local services: 0.8% - 1.8%. Lower platform-side, but DM open rate is what actually matters in this niche.
Compare yourself to the closest niche above, not to the platform average. The platform average is dragged up by food and dragged down by enterprise B2B.
Three Ways to Calculate Engagement Rate (And When to Use Each)
"Engagement rate" sounds like one number. There are actually three different formulas in common use, and they answer different questions. Picking the wrong one for your situation is the most common reason people argue about whose engagement rate is better.
Engagement rate by followers (ERF)
ERF = (likes + comments + shares + saves) / followers x 100
Use this when comparing across accounts you do not own (you cannot see anyone’s reach). This is the public-facing engagement rate everyone quotes. It is what our calculator above returns and what nearly every influencer marketing platform reports.
Engagement rate by reach (ERR)
ERR = total engagements / unique accounts reached x 100
Use this when you own the account and are diagnosing content quality. Reach-based ER ignores the dead-follower problem - it tells you what percentage of people who actually saw the post engaged with it. A reach-based ER above 8% is excellent regardless of niche.
Engagement rate by impressions (ERI)
ERI = total engagements / total impressions x 100
Use this when you are running paid promotion and one user might see the post multiple times. ERI is always lower than ERR for the same post. Brands optimizing ad creative use this to compare creative variants.
If you only have one number to report - for a partnership pitch, an investor update, a creator media kit - use ERF. It is the standard. If you are improving your own content, work in ERR; it is the honest one.
Not All Engagement Counts Equally
The formula adds likes, comments, shares, and saves together as if they are interchangeable. They are not. Instagram’s ranking model weights them very differently, and the gap has widened in 2026 after the most recent Reels-feed rebalance.
Here is the rough signal weight order from least to most valuable for algorithmic distribution:
- Likes - cheapest signal. The bar to like a post is very low. Likes still count in the rate, but a post with 5,000 likes and 0 saves will not get pushed further by the algorithm.
- Profile visits - not in the formula but a strong intent signal. If a post drives profile visits, the algorithm reads that as "this content made someone want to know who this is."
- Comments - much higher value than likes. A comment takes effort. A reply to that comment from the creator counts twice (in your favor).
- Shares to DM - the algorithm interprets this as social proof - "this is worth sending to a specific person." High weight in Reels distribution.
- Saves - the gold standard. A save is the user telling Instagram "I want to come back to this." Carousels with high save rates are the single most effective post format for growing follower count organically.
If you want to push your engagement rate higher in a way that actually increases reach, optimize for saves and shares-to-DM first. Likes and comments will follow.
Six Common Mistakes When Calculating Engagement Rate
Most people get their own engagement rate number wrong. The math is simple - the inputs are where it goes off the rails.
- Using a single post. One viral Reel will give you a 12% engagement rate and a totally false sense of your baseline. Average at least the last 10 posts.
- Forgetting saves. Saves are only visible if you own the account or have access to Insights. People auditing other accounts often skip saves, which undercounts engagement by 20-40% in niches like food and finance.
- Mixing post types. Reels, carousels, and single images perform differently. Compare like-to-like or split the rate by format.
- Including the latest post. Posts under 48 hours old have not finished gathering engagement. Excluding the most recent post avoids a falsely low number.
- Comparing to the wrong tier. A 200K-follower account benchmarking against nano-influencer rates will always feel like it is underperforming. Match the benchmark to the actual follower count.
- Ignoring the fake-follower drag. A 1.4% engagement rate at 100K followers could be a great 2.8% rate against the real, non-bot 50%. Run our fake follower checker first if the number looks weirdly low.
How Engagement Rates Have Changed (2024 - 2026)
Instagram engagement rates have been trending down across every tier for three reasons that compounded over the last 24 months.
First, the Reels-first algorithm change. Reels reach much further than carousel or single-image posts, but they engage at a lower per-impression rate. If your feed shifted from mostly-carousels to mostly-Reels in the last year and your engagement rate dropped, that is the cause, not your content getting worse.
Second, the AI-generated content flood. The platform is saturated with low-effort AI graphics and stock-footage Reels. Users scroll faster and engage less. Even great content gets less engagement than the same content got in 2023.
Third, the multi-account audience. The same human now follows you on Instagram, TikTok, YouTube Shorts, and X. The attention they had for one platform now splits across four. Cross-platform engagement has not declined; per-platform engagement has.
The benchmarks table above already reflects the 2026 reset. If you are comparing your current numbers to a 2022 benchmark you saw on a Hootsuite blog post, you will feel terrible for no reason. Use current data.
How Brands Actually Use Engagement Rate in Partnership Decisions
If you are a creator hoping to land brand deals, you want to know what brands are actually looking at when they evaluate your engagement rate. Here is the honest version, based on conversations with brand-side marketing leads.
Brands rarely look at engagement rate in isolation. They cross-reference it against three other signals: fake-follower percentage (does the audience even exist?), audience geo and language match (do the right people exist?), and content-niche relevance (does the audience care about this product?). A creator with a 1.6% engagement rate and a 96%-real, 92%-US, perfectly-on-niche audience will outperform a 4.2% rate from a creator with a giveaway-loop history and a global pop-up audience every single time.
The minimum bar most brands quietly use: 1.5% engagement rate by follower for accounts above 100K, 2.5% for 10K-100K, 4% for under 10K. Below that, your media kit will not get a reply unless your audience match is exceptional.
Above those thresholds, what brands actually pay attention to is engagement quality. Are comments substantive or "🔥🔥🔥"? Are saves coming from people who later visit the brand’s website? Are shares-to-DM happening between aligned accounts? Modern brand briefs increasingly ask for engagement quality screenshots, not just the rate number.
UKK
Seuraa sitoutumisasteita automaattisesti
Seuraa sitoutumisasteita automaattisesti kaikilla tileilläsi Inflowaven avulla. Reaaliaikaiset analytiikat, historialliset trendit ja toiminnalliset näkemykset.
Opi lisää Instagramin kasvusta YouTube-kanavallamme
Engagement rate calculators by platform
Same formula, different benchmarks. Pick the platform you actually care about.
Facebook Page ER Calculator
Page-level ER with Facebook-specific benchmarks (0.4% average, 1% above average).
TikTok Engagement Calculator
Reach-based TikTok ER. Higher baseline than IG (5-9% nano) because the algorithm pushes harder.
Followers Tracker
Daily follower delta with 14-day trend. Pair with ER to detect fake-follower bloat.
Fake Follower Checker
Audit the audience your ER number is divided by. Real ER = engagement / real followers.
Go deeper on engagement and growth
Best Instagram tools for SMMA agencies (2026)
The full toolkit serious agencies layer on top of ER calculators - analytics, scheduling, DM automation.
Read articleGuideDetect and remove fake Instagram followers
A 1.6% ER on a 50%-real audience is actually a 3.2% ER. Step-by-step cleanup process.
Read articleGuideHow to turn high engagement into actual sales
Engagement rate is not revenue. The 4-step funnel that converts saves and shares into customers.
Read articleEngagement rate glossary
- Engagement Rate by Followers (ERF)
- Total engagement on a post divided by total followers, expressed as a percentage. Most common public benchmark and what brand-deal sheets reference. Tends to underestimate post quality on accounts with stale followers.
- Engagement Rate by Reach (ERR)
- Total engagement divided by post reach (unique viewers). Higher than ERF because it ignores followers who never saw the post. Only visible in Instagram Insights for accounts you own. Best signal of content quality, worst signal of account health.
- Engagement Rate by Impressions (ERI)
- Total engagement divided by total impressions (views, including repeat views). Lower than ERR because the same person counted multiple times. Used internally by media buyers when comparing paid vs organic post performance.
- Save rate
- Saves divided by reach. The single highest-weight signal in the modern Instagram algorithm. A 0.8% save rate on a carousel pushes the post much further than 5% likes.
- Shares to DM
- When a viewer sends your post privately to another user. Counted as engagement but weighted higher than likes because it signals strong social proof. Heavily prioritized in Reels distribution.
- Algorithmic decay
- The natural drop in engagement rate as an account grows. A 25K account at 4% will mathematically struggle to hold 4% at 250K because the algorithm cannot show every post to every follower. Not a content problem - a math problem.
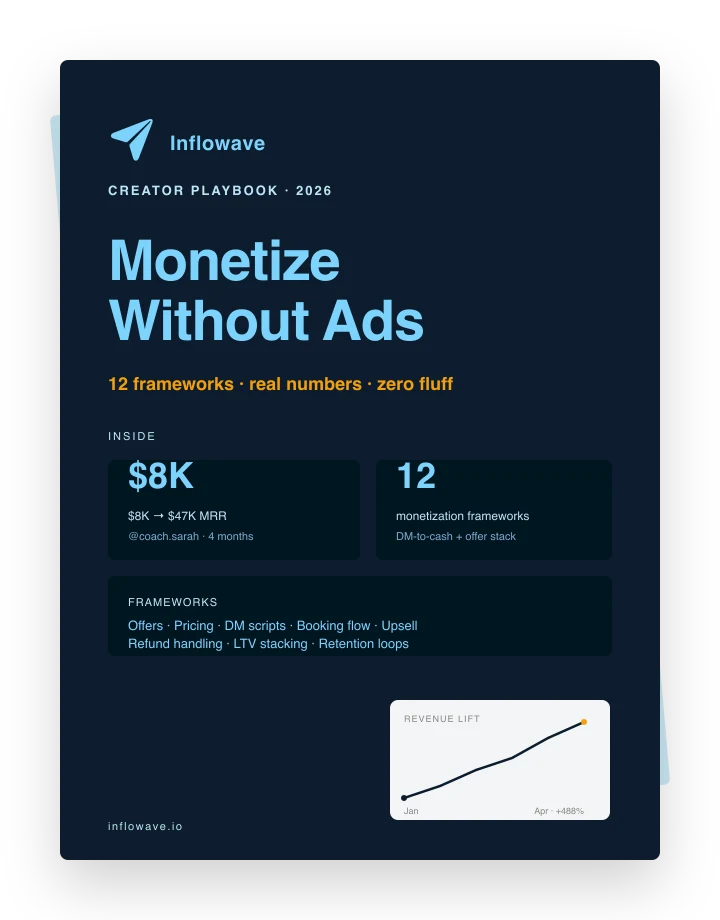
Monetisoi Ilman Mainoksia
12 kehystä, joita luojat käyttävät muuttaakseen DM:t rahaksi. Todelliset luvut todellisilta tileiltä. Mukana $8K - $47K MRR analyysi.