


The Instagram Analytics Playbook - What to Measure and Why
The metrics that actually drive growth, the ones to ignore, and how Inflowave surfaces what Instagram Insights buries.
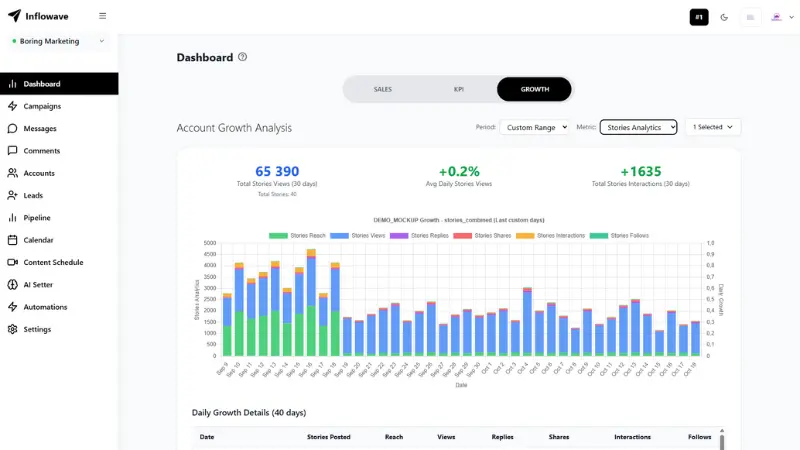
Why Instagram Insights leaves money on the table
Instagram's native Insights surface vanity metrics (impressions, reach, follower count) and bury the metrics that drive business outcomes (save rate, share rate, reach-to-follower ratio, DM volume per post, conversion attribution). Even worse, Insights aggregates everything to averages and trends without exposing per-post or per-creative breakdowns that would let you actually optimize. The result is operators making content decisions based on what Instagram chose to show them rather than the data that actually matters. Inflowave Analytics pulls the raw API data and surfaces the metrics that predict business growth, plus historical trend lines that the native app deletes after 90 days.
Save rate - the single most important Instagram metric in 2026
Save rate (saves divided by reach) is the strongest predictor of continued algorithmic distribution. Posts that save above 2-3% of reach in the first 24 hours typically keep getting pushed for 7-14 days. Posts that save below 1% see distribution cap quickly. Inflowave tracks save rate per post with niche-specific benchmarks so you know whether your 1.8% save rate is great (in some niches it is) or weak (in others, you need 4%+). Save rate also predicts content quality more reliably than likes because saves require active intent rather than passive scroll behavior.
Share rate - the reach-expansion signal
Share rate (external shares + DM forwards divided by reach) predicts whether a post breaks out of your existing follower base. Posts above 1% share rate routinely earn 5-10x normal reach because every share triggers algorithmic distribution to the sharer's network. Inflowave tracks both share types separately because they signal different things: DM forwards indicate intimate value (your audience thinks specific friends need to see this), while external shares indicate broad social currency (your audience thinks they look smart for sharing this). Both matter but their content patterns differ.
Reach-to-follower ratio - diagnosing algorithmic suppression
Healthy accounts reach 50-150% of their follower count per post. Below 30% sustained indicates algorithmic suppression (something is causing Instagram to deprioritize your content). Above 200% indicates content breaking out of your existing audience. Inflowave shows this ratio per post over time, surfacing patterns: if your last 5 posts have all reached <30% of followers, the algorithm has flagged something - usually a suppressed hashtag, a content category change confusing the classification model, or an inconsistent posting cadence. Catching this in week 1 saves months of stalled growth.
DM volume per post - the commercial-intent signal
DMs are higher-intent than likes or comments. A post that generates 50 DMs from 10,000 reach is dramatically more valuable than a post with 10,000 likes and zero DMs - because DMs are conversations with closing potential. Inflowave tracks DM volume per post and per content category, surfacing which content topics drive commercial intent vs entertainment-only engagement. Most operators discover that 2-3 specific content angles drive 70% of their DM pipeline, while their highest-reach posts produce no DMs at all.
Profile-visit-to-follow conversion rate
Your bio is your landing page for non-followers. Of everyone who visits your profile in a given week, what percentage follows? Below 2% means your bio, pinned content, or first-impression Reels are not converting visitors. Above 8% means your top-of-feed real estate is doing the work. Inflowave breaks this metric down by visitor source (organic post discovery, hashtag-driven, direct profile visits) so you can identify which traffic sources convert best and where the bio is leaking visitors. Many operators discover their organic-post-discovery traffic converts at 4x the rate of hashtag-driven traffic - a clear signal to invest more in content quality vs hashtag optimization.
Story metrics - beyond view count
Story view count is a vanity metric. The story metrics that matter: completion rate (do viewers reach the last story in your sequence?), tap-back rate (do they re-watch sections?), tap-forward rate (do they skip ahead?), exit rate per frame (where do they drop off?), reply rate (how many DM replies per story posted?), and link-sticker click rate. Inflowave surfaces all six per story and per sequence so you can identify which Story sequences drive engagement and which lose viewers in the middle. Most operators discover their 3rd-4th story in a sequence is where they lose 40-60% of viewers - usually a content-pacing issue easily fixed.
Audience demographics and the niche-fit check
Instagram Insights shows you top countries, top cities, and rough age breakdowns. Inflowave goes deeper: audience occupation patterns inferred from bio data, audience purchasing intent signals from comment language, niche-fit score (how well your audience matches your ideal customer profile), and audience-quality score (are your followers active engagers or dormant accounts?). For agencies, this lets you tell clients honestly whether their followers are buyers or vanity numbers. Audience-quality scores below 40 signal a follower-buying or contest-spam history that won't convert regardless of content quality.
Hashtag performance attribution
Hashtag performance is a black box in native Insights. Inflowave tracks reach contribution per hashtag per post: when you use #fitnessfornewmoms on a Reel, exactly how many impressions came from that hashtag vs from your followers vs from explore-page algorithmic distribution? After 30 days of tracking, patterns emerge: 2-3 specific hashtags drive 70% of your hashtag-attributed reach; other hashtags contribute nothing despite being on every post. Pruning the dead hashtags and doubling down on the winners often lifts overall reach 15-30%.
Competitor benchmark tracking
Knowing your save rate is 2.4% is useless without context - is that good or bad for your niche? Inflowave benchmarks your metrics against tracked competitors in your niche so you see relative performance. You're at the 65th percentile for save rate but 28th percentile for share rate, which tells you specifically which metric to focus on. Benchmarks update as competitors post so you see real-time competitive positioning rather than annual industry averages that are usually 12 months stale.
Content-pillar performance attribution
Most operators run 4-6 content pillars (education, BTS, social proof, entertainment, promotions, etc.) but can't tell which pillars actually drive followers vs which entertain without converting. Inflowave tags every post by content pillar and surfaces performance per pillar: follower growth contribution, DM generation rate, save rate, share rate, engagement consistency. Patterns emerge - usually one pillar drives 50%+ of your follower growth, one pillar drives 60%+ of your DMs, and one pillar produces high engagement but zero business outcomes. Adjusting the content mix based on this data typically lifts overall pipeline 30-50% within 90 days.
How analytics feeds content strategy, not just reporting
Most analytics tools generate weekly reports nobody reads. Inflowave Analytics surfaces actionable insights: "Your Tuesday 8am Reels save at 2.3x your channel average - increase Tuesday posting frequency." "Your 'client transformation' content category drives 4.1x more DMs per post than 'general tips' - shift your content mix." "Posts with on-screen text in the first 1.5 seconds reach 60% more accounts than posts without - make this your default editing template." Each insight is an action you can take this week, not a number to admire. Analytics that don't change decisions are vanity dashboards; Inflowave Analytics is designed to drive decisions.