A pipeline where the deal already knows the story
Every other pipeline starts a deal at a name and a number. Here it opens with the post they commented on, the pages they read, how far into the video they got and the message that changed their mind.
Board or list, stage rules the workflows cannot argue with, setter and closer both on the record.
Get StartedWhere the deal has actually been
Open a deal in most CRMs and you get a name, a value, a stage and a notes field somebody has half filled in. The information you actually want before a call, which is what this person has already done, lives somewhere else or nowhere at all.
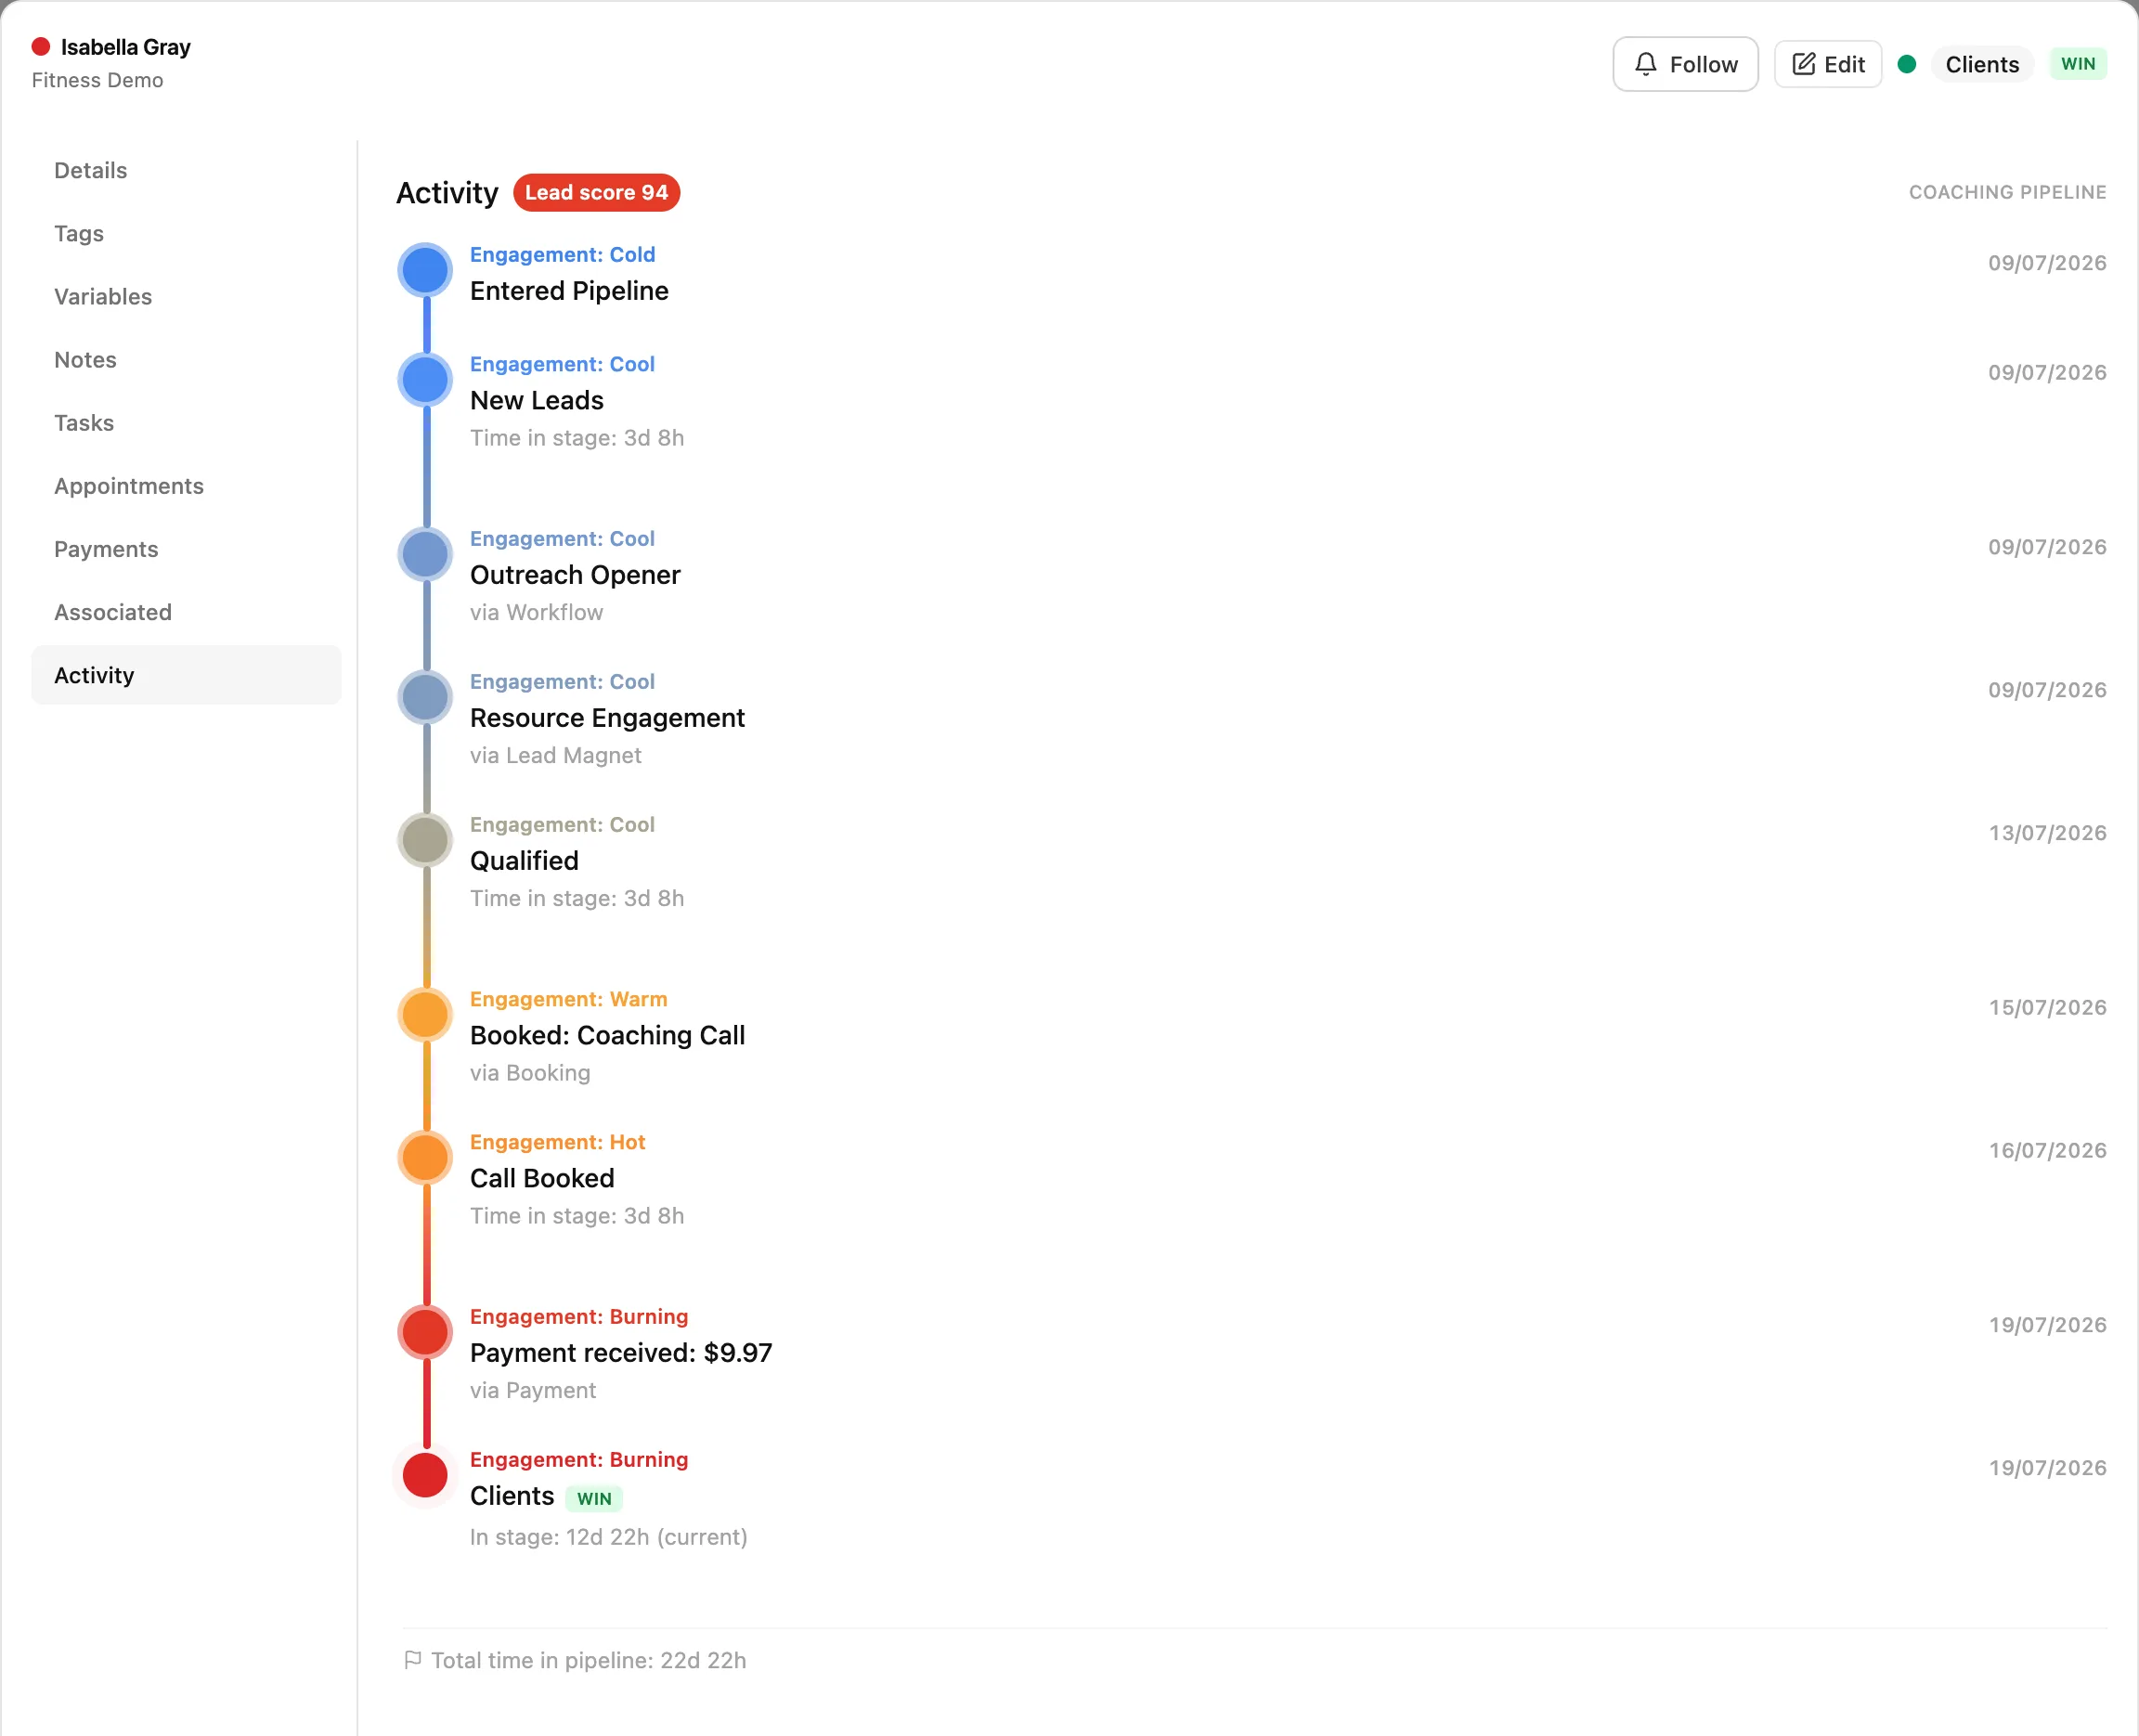
Because a deal here is attached to a lead, and the lead has been tracked since the first touch, the card opens onto one chronological feed of everything. It reads like a story, oldest first, and it is usually obvious from ten seconds of scrolling whether this is a serious buyer or somebody who filled in a form.
How they found you, and whether they came back
The first entry is the first visit and where it came from. After that, every page they looked at. A return after a gap is called out as a return, with the length of the gap, because somebody coming back after eleven days of silence is a different conversation from somebody who has been reading all week. Repeat visits collapse so the feed stays readable and expand when you want them.
Worth knowing where that comes from, because the surprising part is that it works backwards. The visits are collected by the site pixel while the person is still anonymous, and when they eventually fill in a form the whole history folds onto them, first visit marked as the first touch. So a deal opened today can carry three weeks of reading that happened before you knew their name. That side of it is heatmaps and session recordings, where you can also watch the visit rather than only read that it happened.
What they opened, watched and clicked
Tracked links appear by name, so you know it was the pricing link and not just a link. Videos show as sent and then as watched, which is the single most useful signal on the whole feed: a lead who watched the whole thing and went quiet has an objection, and a lead who never opened it has a different problem entirely. Those are opposite situations, and a plain follow-up sequence treats them the same.
Both come from the tracking links, so no extra setup is involved once you are using them.
Every message, whichever channel it was on
Replies, comments they left on your posts, emails, texts, messages the AI sent on your behalf. Interleaved with everything else, so you can see that the reply came twenty minutes after they read the pricing page, which is the sort of thing that tells you what the call should open with.
The threads themselves live in the unified inbox, one click from the deal.
Forms, bookings, money
Forms submitted by name. Appointments booked, and then separately confirmed or cancelled, which is how you spot the pattern of a lead who books and cancels twice before showing up. Invoices sent, payments received with the amount. On a returning customer the feed goes back through the last purchase, so an upsell conversation starts from what they already bought instead of from nothing.
How long everything took
Stage moves sit in the same feed as the activity, each carrying how long the deal sat in that stage, with a total time in pipeline at the end. Entering the pipeline is its own marked event, and so are the win and the loss. So the question "why did this take five weeks" has an answer you can read rather than reconstruct.
The parts that matter
- A deal card carrying the whole lead history, not a name and a value
- Board view and list view on one toggle, with real per-stage totals and CSV export
- Custom stages, with two levels of lock against deals being dragged backward
- Outcome held separately from stage: open, won, lost or abandoned, with who set it and when
- Setter and closer as two named people on the same deal
- Seven pipeline events workflows can trigger on, including a deal sitting too long in a stage
- AI that reads your stage descriptions and files leads into the right one
- Meetings that update the deal themselves: Fireflies or Zoom transcript in, stage move, tags, score, note and follow-up out
- Review mode, so a person approves those changes until you trust them
- Custom fields per pipeline, any of which can show on the card face
- Filtering with nested and-or groups, not one row of dropdowns
- Tasks, appointments, payments, quotes, encrypted notes and watchers on the deal itself
- A pipeline per client, archivable, with deals movable between pipelines
- Conversion rate for every stage transition, and average time to close
- Live updates, so two people working one list do not both open the same lead
Two things are not on that list on purpose. There is no probability-weighted revenue forecast, and the AI does not suggest a next action per deal. Both are covered further down rather than quietly left out.
Two views, and totals that are not lying to you
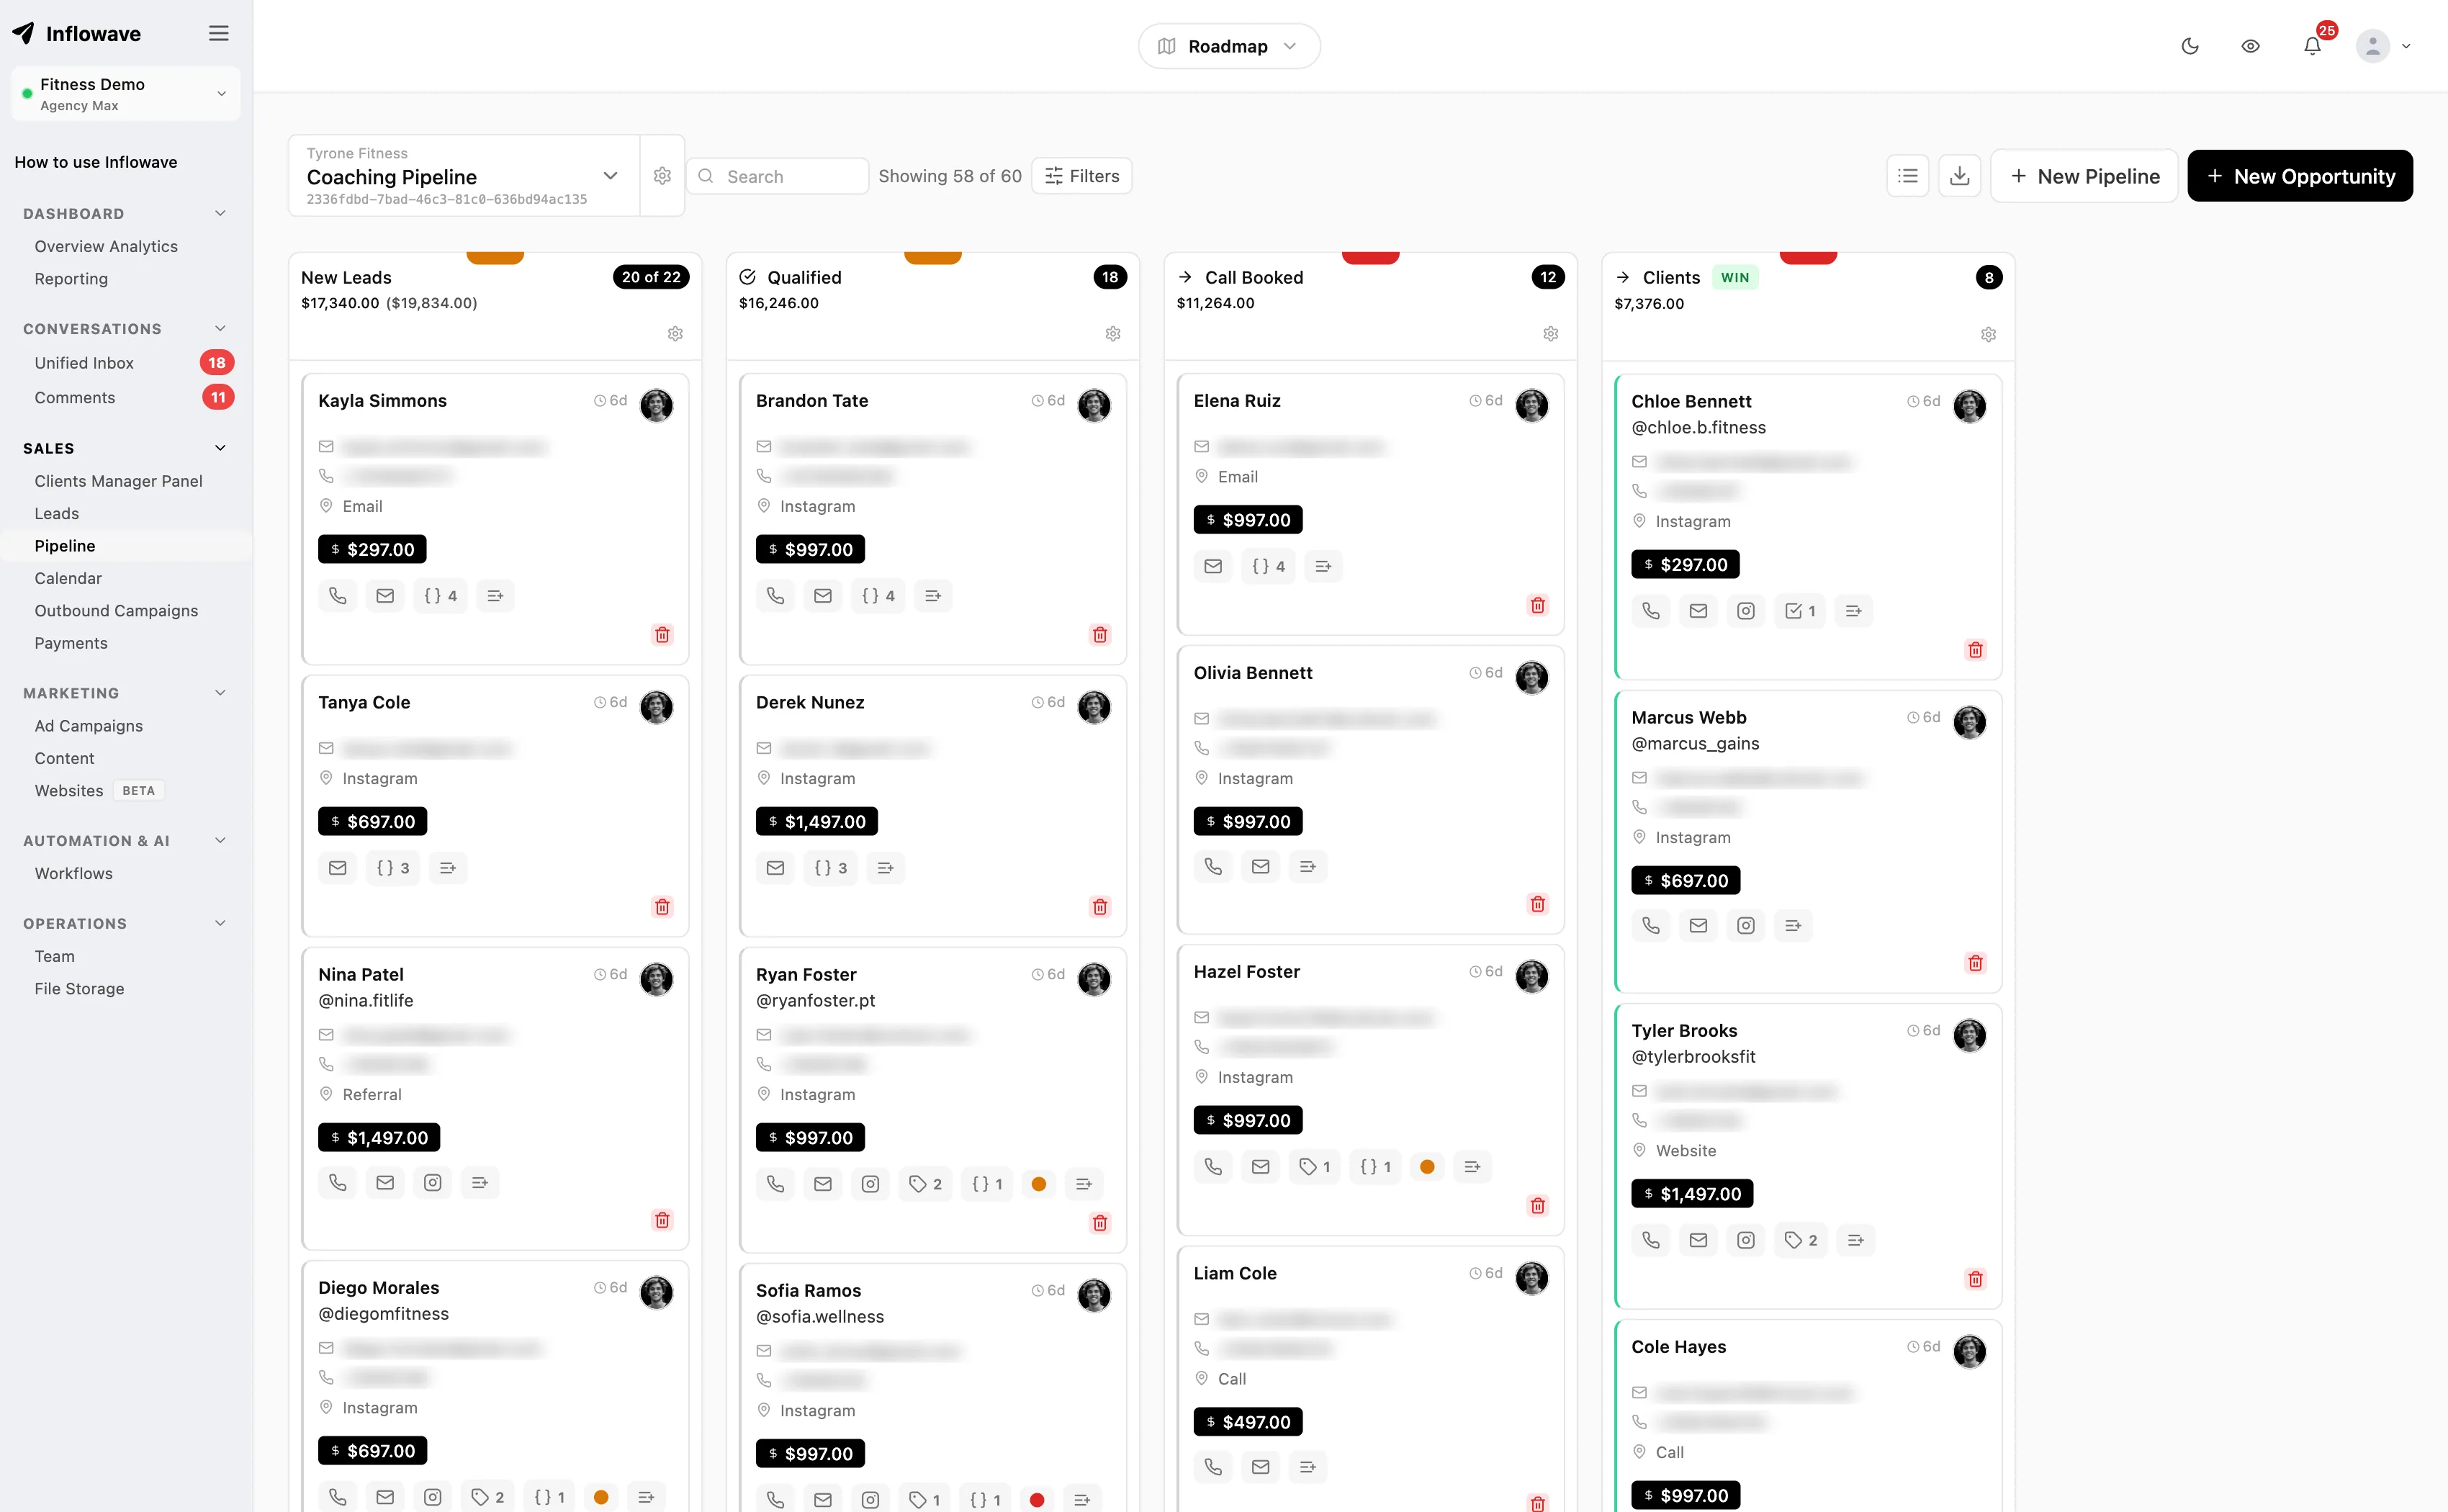
The board is columns of cards you drag between stages. The list is rows you can sort, read in bulk and export. One toggle, same data, and both are useful for different jobs: reps work the board, whoever reports on the month works the list.
The detail worth knowing is that each stage header shows the true count and the true total value across every deal in that stage, not the total of the cards currently loaded on screen. Most Kanban boards page their columns and then sum what they happen to be holding, so the number quietly shrinks the moment a stage has more deals than fit.
What a card shows
Name, value, who it is assigned to, the tags on the lead, how many open tasks it has, the lead score, and any custom field you chose to surface. The open-task count is a small thing that changes behavior, because a deal with no next task is visible as a deal nobody is doing anything about.
Filtering the board down
By connected account, by client, by stage, by date range, or down to just the unassigned. You can sort the cards within a single stage, which is how you work a column properly rather than dealing with whatever is at the top.
It updates while you watch it
Changes arrive over a live connection rather than on refresh. The case that matters: two setters on one list, both about to open the same conversation, one of them now seeing that it moved.
Getting the data out
CSV export from the list view, respecting whatever you have filtered to. Not glamorous, and the first thing anyone asks for when they want to do something we have not built.
Stage rules, so the board stays honest
A pipeline is only worth reporting on if the stages mean something. The failure is always the same and it is rarely malicious: a rep drags a deal back from Proposal to Qualified because it went cold, and now the conversion rate for that transition is wrong forever and nobody knows. There are two levels of protection and they are deliberately different in strength.
Confirm before any backward move
A pipeline-wide setting. Drag a deal to an earlier stage and you are asked whether you meant it, with the option to go ahead. Enough for honest mistakes, which is most of them, and it does not get in the way when the move is genuinely right.
It behaves the same whether the move came from a drag, the edit form or the stage picker on the card, which sounds obvious and is the sort of thing that is usually only wired into one of the three.
Lock a stage once it has been passed
Set per stage, and much harder. Once a deal has been past that stage it cannot return to it or to anything before it. Use it on the stage that means a real commitment happened, the contract sent or the deposit taken, where going backward is not a thing that can truthfully occur.
This one is enforced in the database rather than in the interface. So the board, the edit form, your workflows and the AI all get refused in exactly the same way, and nobody works around it by going through the API. That is the entire point of building it down there: a rule enforced in the front end is a suggestion.
Worth saying: HubSpot has native pipeline rules that do this too, and theirs are more configurable than our two switches. The difference is that theirs can be bypassed by super admins and anyone who can edit property settings, where a database trigger cannot be talked round by anybody.
The outcome is a fact, not a column
Most pipelines express the result by having a Closed Won column at the end. It works until you want to know where deals actually close, at which point you cannot tell, because everything that closed is sitting in the same place.
So the outcome is held separately from the stage: open, won, lost or abandoned, with the time it changed and the person who changed it. A deal marked won stays in the stage it was won from. Over a few months that tells you something useful, which is that half your wins never reached the stage your process says they should have, and your process is longer than your customers need it to be.
Abandoned earns its place as a separate outcome. Lost is a decision, somebody said no, and it belongs in a long nurture. Abandoned is a silence, and it wants chasing differently and counting differently. Teams that fold the two together end up with a win rate that looks worse than it is and a follow-up list that treats a rejection like a missed call.
This one is not our idea and we should say so. GoHighLevel has exactly these four statuses, and Pipedrive has had status separate from stage for years. It is the right design; we are not the ones who worked it out.
Two people on one deal
Setter and closer are separate fields on the deal. Not an owner and a mention in the notes, two named people the reporting can tell apart.
The reason this matters is money. In a setter-to-closer team one person starts the conversation and books the call and another one closes it, and a single owner field forces you to pick which of them the deal belongs to. Whoever is not picked becomes invisible in the numbers, and it is always the setter, because the closer is the one holding the deal at the end. Then commission season arrives and someone is rebuilding the month from DM screenshots.
The handoff itself is the other half. The closer opens the deal and the setter notes and the whole conversation are already on it, so the call does not open by asking the lead to repeat what they told somebody else on Tuesday. That is the moment most teams lose deals they had already won.
See how setter and closer teams run this, and how the booking hands over.
What the pipeline can set off by itself
The pipeline is wired into the workflow engine in both directions: pipeline events start workflows, and workflow steps change deals. Eleven hooks exist, and the one people underestimate is the third.
| Type | Hook | What people use it for |
|---|---|---|
| Trigger | Opportunity created | A deal appears. Notify the closer, start a nurture, add the contact to a retargeting audience. |
| Trigger | Stage changed | The workhorse. Moving to Proposal sends the proposal; moving to Booked starts the reminder sequence. |
| Trigger | Time in stage | Pick a stage and a number of hours or days. Nothing moved, so chase it. This is the one that stops deals rotting quietly. |
| Trigger | Won | Send the invoice and the contract, start onboarding, post the number to the team channel. |
| Trigger | Lost | Drop into a long-cycle nurture. A no in March is frequently a yes in September. |
| Trigger | Abandoned | Different from lost, and worth treating differently. Nobody said no, everyone stopped talking. |
| Trigger | Reopened | A closed deal comes back to life. Pull the old thread and the notes up for whoever takes it. |
| Action | Create or update the deal | One action that creates the deal if it does not exist and updates it if it does, so a second form submission never produces a duplicate. |
| Action | Set the outcome | Mark won, lost or abandoned from automation. A paid invoice can close its own deal. |
| Condition | Stage is | Branch on where the deal sits, so one workflow can behave differently for a cold lead and a live negotiation. |
| Condition | Value over | Route the big ones to a person and let the small ones run automated. Most teams want this and never build it. |
Time in stage is the one worth setting up on your first day. Every pipeline that has ever been abandoned died the same way: deals stopped moving, nobody noticed for three weeks, and by the time somebody looked the board was a graveyard nobody trusted. Pick a stage, pick a number of days, and have something happen. Even if all it does is put a task on somebody.
In fairness, Pipedrive handles the same problem better in one respect: their rotting feature turns the card red on the board, so you see it without having built anything. Ours acts, theirs shows. Ideally you want both, and for now we only do the acting.
The engine itself is covered in the workflow builder.
Can AI move leads through the stages by itself?
Yes, and the control you have over it is the stage description. Every stage has a description field, and the AI reads it to decide where a lead belongs based on what has actually been said in the conversation.
Which means the descriptions are worth writing as instructions rather than labels. A stage described as "has asked what it costs but has not been given a number yet" gets used correctly. A stage described as "Stage 3" does not, and then the AI looks stupid when the fault is in the setup. Write them the way you would explain the pipeline to somebody joining the team on Monday.
The stage locks still apply to the AI. It cannot pull a deal back past a locked stage any more than a person can, which is what makes it safe to let it file things at all. The AI also writes a summary of the conversation on the deal, on demand, which is the fastest way to pick up a thread you have not read in a fortnight.
What it does not do is tell you what to do next. There is no next-best-action suggestion on a deal here. The AI reads and files and summarizes; the judgement about what this particular buyer needs is still yours, and we would rather not dress up a guess as advice.
The real problem with pipelines is that nobody updates them
Every pipeline works in week one. By week six a third of the deals are in the wrong stage, the values are whatever somebody guessed in March, half of them have no next step, and the ones that died are still sitting there because closing a deal as lost is admin nobody is rewarded for. The board stops describing the business, everybody quietly stops trusting it, and then it is a chore that produces a number the founder does not believe.
This is not a discipline problem and it does not get fixed by asking people to be tidier. It is that updating a pipeline is pure overhead for the person doing it: the rep already knows where the deal is. The record is for everyone else. So the only durable fix is for the update to happen without a human doing data entry.
That is what the stage descriptions and the meeting integration are actually for. You describe your process once, in writing, and then the conversations and the calls maintain the board.
You write the criteria, the AI applies them
The stage description is not a label for the column header. It is the rule the AI files by. Write what has to be true for a deal to belong there, in the words you would use explaining it to a new hire, and the AI reads the conversation against those criteria and moves the deal when it matches. So the process lives in one place, written down, instead of in the head of whoever has been there longest.
The call ends and the record changes
Connect Fireflies with your own API key and turn on auto-record for an event type. From then on, when somebody books that meeting through Inflowave, the notetaker joins the call by itself. Nobody has to remember to invite it, which is the step that kills every version of this that depends on a person.
When the transcript comes back, the AI reads it and acts on the deal. It can move the stage, add tags, adjust the lead score, write the note, draft the follow-up email, and book the next meeting. The summary, the action items, the sentiment, the next steps, the key topics and the objections raised all get written onto the lead timeline, so the next person to open that deal reads what happened on the call without listening to it.
Zoom feeds the same thing, and the bookings themselves come from the booking calendars.
What that looks like on one discovery call
- A lead books a discovery call from a DM. The deal is already on the board with the whole thread on it.
- The notetaker joins the call on its own, because the event type has auto-record turned on.
- They say the budget is fine but they need their business partner on the next call.
- The transcript comes back. The deal moves to the stage whose description says a decision maker is still missing.
- The lead score goes up, a tag goes on, and the summary, objections and next steps land on the timeline.
- The follow-up email is drafted with the booking link for the second call.
- The closer opens the deal the next morning and reads all of it in about fifteen seconds. Nobody typed anything.
Approve it first, if you would rather
Applied automatically is the default, and plenty of teams should not run it that way to begin with. Switch to review mode and the whole draft is held as a suggestion for the person who hosted the meeting, who approves it, edits it first, or throws it away. Only the host sees their own meetings. You can set it per employee, per client or for the whole agency, so a new setter can be on review while the senior closer is on automatic. Most teams should start on review for a fortnight and then stop bothering.
What it does not do, and what it does with your recordings
We do not record the meeting ourselves. Fireflies does, on your own account and your own API key, and connecting it involves pasting a webhook into their settings once. Auto-invite currently covers meetings booked through Inflowave, so a call created straight in Google Calendar or through Calendly will not have the notetaker added for you.
On the recordings themselves: the raw transcript never leaves our infrastructure. Only a stripped, anonymised extract goes to the model that summarizes it, and the fields holding personal data are encrypted at rest. Worth knowing before you point a notetaker at every sales call your company makes.
Your fields, and finding things with them
Custom fields, defined per pipeline
Text, number, date, yes-or-no, or a dropdown with your own options, each with a default value if you want one. Defined per pipeline rather than globally, which matters for an agency, because the fields that make sense for a roofing client are not the fields that make sense for a coach. Any field can be set to show on the card face, so the thing your team actually sorts by is visible without opening anything.
Filtering in groups, not one row of dropdowns
Conditions can be grouped, and groups can contain groups, with and-or logic between them. That is what it takes to express a real question: in Proposal or Negotiation, over five thousand, came from Instagram, budget field not empty, nobody assigned. One flat row of filters cannot say that, which is why people end up exporting to a spreadsheet.
The lead score, and where it comes from
Set by your workflows, on your rules, not by a model we will not explain. The card shows the number and a cold, warm or hot reading, and the timeline shades each event by the score the lead had at the time. So you can watch interest building over three weeks, or falling off a cliff after one particular message, which is more useful than the number on its own.
Bulk work
Update or delete many deals at once, and move deals into a different pipeline entirely. The usual reason is a campaign ending and two hundred deals needing to go somewhere, or a client moving to a different workspace, and doing that one card at a time is how afternoons disappear.
Everything the deal carries
A deal is a place to work from rather than a record to look at. Open one and the things you would otherwise go and find are tabs on it.
Tasks, with dependencies
Assign work on the deal and make one task wait on another, so the sequence is enforced rather than remembered. The open-task count then shows on the card, which is how a deal nobody is progressing becomes visible from across the board.
Appointments
Book from the deal, and see what is already booked and what has been cancelled. The booking and the deal are the same conversation, so they should not be two places you check.
Payments and quotes
Send a quote and take a payment from the deal, and see the payment history on it. Which is why a won deal here can mean a deal that has actually paid rather than a deal somebody said yes to, and those are frequently not the same month.
Notes, encrypted
Notes are encrypted at rest. Sales notes are candid by nature and frequently contain things about a person you would not want sitting in plain text in a database, which is an ordinary precaution and an unusual one to actually take.
Watchers
Add someone to a deal without giving it to them. A manager watching the three biggest deals of the quarter does not want to own them and does not want to ask about them every morning either.
Your own record types
Linked records from object types you defined yourself, for the things a CRM has no field for. Properties, vehicles, courses, matters, whatever your business is actually made of.
Calling
Place the call from the deal, and the call and its recording end up on the record with everything else.
The conversation
One click from the deal to the thread it came from, on whichever channel that was, with the AI summary on the deal for when you do not have time to read it.
One pipeline per client, in one account
A pipeline can be linked to a client and scoped to a workspace, so an agency running thirty clients is not reading one board with thirty companies mixed into it. The client can be given their own view without seeing anybody else, which is the part that makes it usable rather than just organized.
The switcher shows how many deals each pipeline holds and when each one last had movement, and that second number is the most useful thing on the screen. A client whose pipeline has not moved in nine days is a conversation you want to have before they have it with you.
Beyond that: mark one as the favorite so it opens by default, drag them into the order you actually think in, archive a finished engagement rather than deleting the history, and move a deal from one pipeline into another when it turns out to belong somewhere else. Deals only move between pipelines inside the same agency and workspace, deliberately, because the alternative is a deal quietly crossing a tenancy boundary.
More in the agency use case and agency pricing.
What the numbers will and will not tell you
Conversion per stage transition
Not one overall conversion rate but the rate for each move from one named stage to the next. This is the number that tells you where the process is leaking, and it is almost never where people assume. Teams spend months trying to get more leads when eight out of ten of the ones they have never get from a booked call to a proposal.
Count, value, won and lost, filtered
Deals and total value per stage, with won count and won value and lost count for the period, narrowable to a connected account, to specific clients, or to a number of days. The client filter is what makes the monthly agency report take minutes instead of an afternoon.
Time, and new deals per day
Average time to close, plus new deals per day broken down by stage, so you can see whether last week was quiet at the top of the funnel or quiet in the middle. Those look identical on a monthly total and need completely different responses.
What is missing, plainly
There is no probability-weighted revenue forecast. Nothing here assigns each open deal a percentage chance of closing and adds the results up into a number for next month. Pipedrive and HubSpot both do that, and if somebody asks you for a forecast every Monday, that is a real reason to buy one of them instead.
What you can do here is the honest version of the same thing: you know your conversion rate for each transition and your average time to close, so you can work out what the current board is worth without a model implying more confidence than the data supports.
The wider reporting, including revenue attribution by source, is in the analytics.
Against Pipedrive, HubSpot and GoHighLevel
These are the tools you are actually choosing between. We lose four rows here, including one where we have nothing at all, and leaving them out would only mean you found out later.
| Capability | Inflowave | Pipedrive | HubSpot | GoHighLevel |
|---|---|---|---|---|
| Multiple pipelines with custom stages | Yes | Yes | Yes | Yes |
| Deal outcome as a status, separate from the stage | Yes | Partly | Partly | Yes |
| Block a deal from moving back to a stage it already passed | Yes | No | Yes | Unclear |
| Flag deals that have gone quiet in a stage | Partly | Yes | Partly | Partly |
| A setter and a closer as two named people on one deal | Yes | No | Partly | Partly |
| The DM thread readable on the deal itself | Yes | No | Partly | Yes |
| Page views, video watches and link clicks on the deal timeline | Yes | Partly | Yes | Partly |
| AI reads your stage descriptions and files the lead itself | Yes | Unclear | Unclear | Unclear |
| Tasks, appointments, payments and quotes on the deal record | Yes | Partly | Partly | Yes |
| One pipeline per client, in one agency account | Yes | Partly | Partly | Yes |
| Probability-weighted revenue forecast | No | Yes | Yes | Partly |
- Multiple pipelines with custom stages: Table stakes. Nobody should pick a CRM on this row, and we are not claiming it as a difference.
- Deal outcome as a status, separate from the stage: GoHighLevel has the same four statuses we do, Open, Won, Lost and Abandoned, so this is not our idea. Pipedrive has open, won and lost as a real field but no abandoned. HubSpot expresses the outcome as Closed Won and Closed Lost stages rather than a field orthogonal to stage.
- Block a deal from moving back to a stage it already passed: HubSpot does this natively per pipeline and it covers the API too, though super admins and anyone with Edit property settings can bypass it. Pipedrive support state there is no permission for it; required-fields-per-stage only gates forward moves and is skipped by imports, bulk edits and the API. Ours is a database trigger, so the UI, workflows and the AI all get the same refusal.
- Flag deals that have gone quiet in a stage: Pipedrive wins this row. Rotting is native, set per stage in days, and turns the card red on the board. Ours is a Time in Stage workflow trigger, so it can send the follow-up automatically, but the board does not color the card for you. Theirs is the better signal, ours is the better action.
- A setter and a closer as two named people on one deal: Others have one owner plus collaborators or participants, which you can use for this, but the roles are not first-class so reporting does not split credit by them. We hold setter and assignee as separate fields.
- The DM thread readable on the deal itself: HubSpot has a conversations inbox but Instagram is a third-party connector, so the thread is not natively on the deal. Pipedrive is not a social messaging product. This is a difference in scope, not a defect.
- Page views, video watches and link clicks on the deal timeline: HubSpot matches us here and has done for years; their tracking code plus timeline is mature and we are not going to pretend otherwise. Pipedrive needs the Web Visitors add-on.
- AI reads your stage descriptions and files the lead itself: Marked unclear rather than no. All three ship AI features and all three could plausibly do a version of this; we did not find it documented as stage-description-driven routing, but absence from the docs we read is not proof.
- Tasks, appointments, payments and quotes on the deal record: Pipedrive and HubSpot both do tasks and meetings natively; payments and quotes exist but sit in separate products or paid tiers rather than as tabs on the deal.
- One pipeline per client, in one agency account: You can build a pipeline per client in any of these. The difference is that GoHighLevel and we scope it to a workspace, so a client can be given their own view without seeing the rest.
- Probability-weighted revenue forecast: We do not have this and the page says so. You get pipeline value, value per stage, won value, conversion rate per stage transition and average time to close. If a weighted forecast is what you are buying, Pipedrive and HubSpot both have it and we do not.
Where the others are stronger. Pipedrive is a better pipeline than ours considered on its own. Rotting is a genuinely better idea than our workflow trigger because it changes the board rather than firing an email, the forecasting is real, and twenty years of polish shows in a thousand small places. HubSpot beats us on reporting, on the maturity of its pipeline rules, and on an ecosystem we cannot approach. GoHighLevel arrived at the same four statuses we use and has the same agency-workspace model, so if you are already on it this page is not an argument to move. And none of the three would say what we are about to say: if what you need is a well-built sales pipeline, buy Pipedrive.
What is different is what the card knows. Everywhere else a deal begins when somebody creates it, so the record starts at a name and a number. Here the deal is attached to a lead that already has a history: the post they commented on, the pages they read, how far into the video they got, the link they clicked, every message either way, the call, the booking, the invoice. The closer opens the deal and can see the whole approach rather than a value and a stage. That, the setter and closer being separate people the reporting can split, and stage locks the workflows cannot talk their way around, are the reasons to run the pipeline here rather than beside the inbox.
Competitor capabilities from vendor documentation and vendor support answers, checked 30 July 2026. Where we could not confirm from vendor documentation the cell says Unclear rather than No. Verify any row that decides your choice.
Tool by tool
A table is hard to read a decision out of, so here is the verdict per tool. Each starts with why you might buy theirs, and on the first one we mean it.
Inflowave vs Pipedrive
Buy theirs when: Pipedrive is the better pipeline product and we will not argue it. Rotting is native and per stage and turns the card red, which beats our workflow trigger as a signal. The forecasting is real, ours does not exist. If your team lives in a pipeline all day and the leads arrive by email and phone, buy Pipedrive.
Buy ours when: Two rows go the other way. Pipedrive has no way to stop a deal being dragged backward, by their own support answer, and it is not a messaging product, so the Instagram thread that produced the deal is not on the deal. If your pipeline is fed by DMs, the history is the thing you are missing.
Inflowave vs HubSpot
Buy theirs when: HubSpot matches us on the tracked timeline, beats us on reporting and forecasting, and its pipeline rules are more configurable than our two locks. The ecosystem is not comparable. For a company that already runs on HubSpot, staying is almost always right.
Buy ours when: The outcome is a stage rather than a field, so Closed Won is a place a deal sits instead of a fact about it. Instagram is a third-party connector. And the pipeline rules can be bypassed by super admins and anyone with Edit property settings, where ours is a database trigger that refuses the write whoever asks.
Inflowave vs GoHighLevel
Buy theirs when: GoHighLevel has the same four statuses, the same stage-changed and status-changed triggers, the same agency workspace model, and a lost-reason filter we do not have. It is the closest product to this one in the table. If you are on it already, the pipeline is not the reason to move.
Buy ours when: The differences are the setter and closer as separate fields the reporting can split credit by, the stage lock enforced in the database, and the depth of the timeline on the deal. Whether those matter depends entirely on whether you run a setter-to-closer team.
Who this is built for
Agencies running setter and closer sales teams
The case the whole thing is shaped around. Two roles on every deal, the history traveling to the closer so the call opens informed, stage locks so the board survives contact with commission, and Time in Stage catching the deals that go quiet between the handoffs. If your agency runs setters, most of this page is about you.
Agencies running deals for other people
A pipeline per client, scoped so nobody sees anybody else, custom fields that differ per client because their businesses do, analytics filterable to one client for the monthly report, and archiving instead of deleting when an engagement ends. The last-movement figure in the switcher is the closest thing here to an early warning system for churn.
More in the agency use case and what we build for agencies.
Agencies with coaching and consulting clients selling from conversations
When the product is the client themselves, the deal is a relationship and the timeline is the whole value. Somebody who watched the entire masterclass and read the pricing page twice is a different conversation from somebody who filled in a form, and on most pipelines those two look identical. Here they do not.
Agencies running small-business clients with one board and no sales ops
The honest version for a small-business client: you do not need most of this on day one. Build one pipeline, five stages, turn on Time in Stage, and ignore everything else. The reason to be here rather than on a cheaper pipeline is that the enquiry arrived as a DM and the deal, the thread, the appointment and the invoice are one place instead of four subscriptions and a spreadsheet holding them together.
The thing that actually changes for a client this size is knowing which stage loses people. When one person is doing the selling between other work, nobody can feel that from memory, and the conversion figures per transition will usually contradict what the agency assumed within the first month.
See how small businesses use Inflowave and what it costs for a small team.
Setting it up
1. Write the stages as sentences
Fewer stages than you think, and a real description on each one saying what is true about a lead who is there. This is the step people skip and the step everything else depends on, because the descriptions are what the AI reads and what a new hire reads. Mark which stages end the deal, and which of those is the good one.
2. Decide what cannot be undone
Leave the confirm-on-backward-move setting on. Then pick the one or two stages that represent something that genuinely happened, the contract out or the deposit in, and lock those. Do not lock everything; a pipeline you cannot correct is worse than one people fudge.
3. Let the deals arrive by themselves
A workflow creating the deal from a form submission, a keyword in a DM or a booking beats anyone remembering to create it. Use the create-or-update action so a second form fill updates the deal instead of making another one, which is the most common way a board fills up with duplicates.
4. Set one Time in Stage rule
One is enough to start. Pick the stage where deals actually die, usually the one after the first real conversation, give it a number of days, and have it create a task or send a follow-up. This is the difference between a pipeline and a list of things that once happened.
5. Read the transitions after a month
Not the overall conversion rate, the individual stage-to-stage numbers, and the stage your wins are actually being marked from. Both will tell you something you did not expect, and one of them usually means a stage in the middle of your process is not doing anything.
Common questions
What is a sales pipeline?
A sales pipeline is the ordered set of steps a deal moves through between first contact and a win or a loss, with every open deal sitting in exactly one step at a time. It exists so you can answer three questions without guessing: how much is in play right now, where deals are getting stuck, and what is likely to close this month. People often use the words pipeline and funnel interchangeably, and they are not the same thing. A funnel describes volume narrowing across a whole audience, which is a marketing view. A pipeline tracks named deals you can each point at and act on, which is a sales view. If you can drag it, it is a pipeline.
What are the stages of a sales pipeline?
Most pipelines run five to seven stages. The common five are lead, qualified, proposal, negotiation and closed. Longer versions split qualification into contacted and qualified, or add a discovery call before the proposal. There is no correct number: the right stages are the ones where something genuinely changes about the deal, and a stage that every deal passes through in a day is not a stage, it is a status. Four or five is usually plenty for a business selling one thing.
How do you manage a sales pipeline effectively?
Three habits do most of the work. Keep the stage definitions strict enough that everyone would put the same deal in the same place. Look at the conversion rate for each stage transition rather than one overall number, because that is what tells you where deals are actually being lost. And have something automatic chase deals that stop moving, because a pipeline dies from deals sitting untouched far more often than from deals being rejected. The rest is mostly discipline about entering things.
What is a pipeline in a CRM?
A pipeline is the set of ordered stages a potential sale moves through, from first contact to won or lost, with each open deal sitting in exactly one stage. It is what turns a list of contacts into a process you can measure: how many deals are at each step, what they are worth, how long they take and where they stop. Most CRMs show it as a board of columns you drag deals between.
Our reps never update the CRM, so the pipeline is always out of date. Is there a CRM that updates itself from sales calls?
Yes, and it works by taking the data entry off the rep rather than reminding them to do it. You connect a meeting notetaker, Fireflies or Zoom, and turn on auto-record for the event type people book. The notetaker joins by itself, and when the transcript comes back the AI moves the deal to the stage whose written description matches what was said, adds tags, adjusts the lead score, writes the note, drafts the follow-up and can book the next meeting. The conversations in the inbox do the same thing between calls. The rep never opens a form, which is the only version of this that survives past week six.
We run setters and closers on Instagram DMs and half the deals die in the handoff. What actually fixes that?
Three specific things, and none of them is a better reminder. The setter and the closer are both named fields on the deal, so neither disappears from the reporting when commission is worked out. The whole DM thread, the setter notes and the lead activity travel with the deal, so the closer opens the call already knowing what was promised instead of asking the lead to repeat themselves. And a Time in Stage rule fires when a booked deal sits untouched, which is where handoff deals actually die: not rejected, just never picked up. The setter and closer breakdown.
I run an agency with about thirty clients. Can I keep a separate pipeline per client without paying for thirty accounts?
Yes. Pipelines are created per client inside one agency account and scoped to a workspace, so each client sees only their own and your team sees all of them. Custom fields are defined per pipeline rather than globally, which matters because a roofing client and a coaching client do not need the same fields. The analytics filter to one client for the monthly report, and a finished engagement is archived rather than deleted so the history survives. The switcher shows when each pipeline last moved, which is the earliest churn signal you get. Agency pricing.
My sales reps drag deals backwards when they go cold, so my conversion numbers are meaningless. Can that be blocked?
Yes, at two strengths. A pipeline-wide setting asks for confirmation on any backward move, which handles honest mistakes. A per-stage lock is absolute: once a deal has passed that stage it cannot return to it, and it is enforced in the database rather than the interface, so the board, the API, your automations and the AI all get refused the same way. Put it on the stage that means something real happened, the contract out or the deposit in. Do not lock every stage, or you will not be able to correct genuine errors.
How do deals get into the pipeline?
Four ways. You create one by hand from the board. You create one from a conversation in the inbox, which links it to that lead. A workflow creates it, which is how most of them appear in practice, triggered by a form submission or a keyword in a DM or a booking. Or you import contacts and add them to a pipeline in bulk. However it arrives, the deal is attached to a lead record, and that is what gives the card its history.
Can I customize the stages?
Yes. Each stage has a name, a display name, a description, a color and a position you set by dragging. You mark which stages are terminal, and which terminal stage is the good one, so the reporting knows Won from Lost without guessing at the name. Two rules exist: every pipeline needs a Won stage and a Lost stage, and the first stage cannot be deleted because deals have to arrive somewhere. Delete any other stage and you are asked what to do with the deals in it, move them or delete them. The leads themselves are never deleted, only the deal records.
Can AI move leads through the stages automatically?
Yes, and the stage description is how you control it. Write the description as an instruction rather than a label, describing what is true about a lead at that point, and the AI reads it and files leads accordingly from what has been said in the conversation. So a stage described as "asked what it costs, has not been given a number yet" gets used correctly, where one described as "Stage 3" does not. It is worth writing these properly once. It is the difference between the AI helping and the AI making a mess you have to undo.
Does it forecast revenue?
Not as a probability-weighted number, and we would rather say so than imply otherwise. You get total pipeline value, value per stage, won value and lost count for a period, conversion rate for every stage transition, average time to close, and daily new deals. What you do not get is a model that assigns each deal a percentage chance and sums the result. Pipedrive and HubSpot both do that properly. If a weighted forecast is what decides your purchase, buy one of those. See what the analytics do cover.
What stops someone dragging a deal backward to flatter their numbers?
Two things, and they are deliberately different in strength. The pipeline-wide setting warns on any backward move and asks the person to confirm, which is enough for honest mistakes. The per-stage lock is harder: once a deal has been past that stage it cannot go back, and because it is enforced in the database, the drag, the edit form, the workflows and the AI all get refused identically. Nobody routes around it by using the API instead of the board.
What is the difference between a stage and an outcome?
The stage is where a deal sits in the process. The outcome is what happened to it, held separately, as open, won, lost or abandoned, with a timestamp and the person who set it. Keeping them apart means a deal can be marked won while sitting in the stage it was actually won from, so you learn where deals close. It also gives you abandoned, which is a genuinely different thing from lost and one most teams never separate: lost is a decision, abandoned is a silence.
How does the setter and closer split work?
Setter and closer are two separate fields on the deal, so both people are on the record rather than one owner and a note. The reason it matters is commission arguments. When one person books the call and another closes it, a single owner field means one of them is invisible in the reporting, and it is always the setter. Here the credit is on the deal for both. How setter teams run this.
What is actually on the timeline?
One chronological feed, oldest first, merging where the deal has been in the pipeline with everything the lead did. First visit and where they came from, pages viewed, a return after a gap called out as a return, tracked links clicked, videos sent and how far they watched, replies, comments on your posts, emails, SMS, AI messages, forms submitted, appointments booked and then confirmed or cancelled, payments received, invoices sent, notes, tags, and any workflow they went through. Stage moves carry how long the deal sat in each stage, and the whole thing carries total time in pipeline.
Is there a table view, or only a board?
Both, on one toggle. The board is for working deals one at a time, and it shows the real count and total value for each stage rather than the total of the cards currently loaded, which is the bug in most Kanban boards once a stage has a few hundred deals in it. The list is for reading a lot of rows at once and for exporting to CSV. Reps live in the board, whoever runs the numbers lives in the list.
How specific can the filtering get?
Groups within groups, with and-or logic, so you can express something like: in Proposal or Negotiation, over five thousand, came from Instagram, budget field not empty, nobody assigned. The board also filters quickly by account, client, stage, date range and unassigned, and sorts within a stage. Custom fields and the lead variables set by workflows are both filterable, so anything you capture is something you can slice by.
Can I run a separate pipeline per client?
Yes, and it is the normal agency setup. A pipeline can be linked to a client, scoped to a workspace, archived when the engagement ends, reordered, and one marked as the favorite so it opens by default. Deals can be moved between pipelines within the same agency and workspace. The switcher shows the deal count and when each pipeline last moved, which is the fastest way to see which client has gone quiet. What we build for agencies.
What can I attach to a deal?
Tasks, with dependencies between them. Appointments, booked from the deal. Payments and quotes. Notes, encrypted at rest. Watchers, so someone gets kept in the loop without owning it. Tags. Custom fields you define per pipeline, any of which can show on the card face. Linked records from your own custom object types. And you can place a call from the deal. About custom objects.
Does the board update when a teammate moves something?
Yes, over a live connection rather than on refresh. It matters most in the case it was built for: two people working the same list, where a stale board means two reps both open the same conversation and the lead gets messaged twice by people who do not know about each other.
Where does the lead score come from?
From your workflows, not from a black box. A workflow sets the score based on whatever you decide counts, and the card shows it as a number with a cold, warm or hot reading, with the timeline dots shaded by the score the lead had at each point. So you can see engagement building or falling away across the whole history rather than just the number today. How workflows are built.
Stop opening deals that tell you nothing
Put every conversation on a board where the card already knows what happened, the stages cannot be quietly rewritten, and both the setter and the closer get their name on the deal.
Get Started