Free Social Media Report Generator
Build a polished monthly client report across Instagram, TikTok, Facebook, LinkedIn, and YouTube - with growth deltas, benchmark scoring, top posts, and recommendations. Export as PDF or open in Google Sheets. No signup.
100% free · No signup · Works for agencies, freelancers, and in-house teams
Social media reporting tools should save you hours, not steal them. Drop in your numbers, pick the platforms you manage, and get an instant client-ready report card with engagement rate, follower growth, top posts, and recommendations. The same template agencies pay $300/month for - free.
How to Build a Social Media Report Your Clients Actually Read
A social media report is the artifact a client uses to decide whether to renew you. Most reports get archived in 30 seconds because they look like a database export - pages of numbers without a story. The reports that get read share three traits: a tight executive summary on page one, a clear delta against last month, and a recommendation for what to do next.
The cheapest way to lose a retainer is to send a report that proves you were busy without proving you moved a metric. Agencies that win renewals lead with outcomes: 'Reach grew 38% MoM, driven by three carousel formats we'll re-run in May.' Numbers serve the narrative - not the other way around.
Why most social media reports get archived in 30 seconds
If you only track seven metrics across every channel, your monthly report is already 80% of the way there. Followers (current and previous to see growth), posts published (cadence), reach (unique accounts seen), engagements (likes + comments + shares + saves), engagement rate (engagements ÷ reach × 100), profile visits, and link clicks. These seven map to the full funnel: awareness → interest → action.
DM conversations started is the bonus eighth metric every IG-heavy account should report on. It's the only metric that maps directly to revenue for service-based clients. A coach with 10K followers and 80 monthly DMs is healthier than one with 100K followers and 5 DMs - and the DM number is the one that actually closes deals.
The 7 metrics every monthly client report needs
Engagement rate is the most-debated metric in social media reporting. The agency-standard formula is engagements ÷ reach × 100. This rewards content that lands with the audience that actually saw it, not the dead followers in your follower count. Avoid engagement rate by followers - it punishes accounts that grew quickly and still produces good content.
For Instagram in 2026, the average engagement rate is 0.7%. Above 1% is good. Above 3% is great. Smaller accounts (under 5K followers) tend to outperform larger ones because algorithms haven't yet diluted their reach with passive followers. Don't compare a 1M-follower brand to a 10K-follower local business - the curves bend.
How to calculate engagement rate the way agencies do it
TikTok benchmarks are the highest of any platform. Average engagement rate sits at 5.7%, with great accounts pushing 10%+. The platform's algorithm gives unknown creators a fair shot at reach, which is why even brand-new accounts can post a video and hit 100K views. Track watch time and completion rate alongside ER - TikTok's algorithm weights both.
Facebook engagement rate has compressed to ~0.15% organic. Don't punish your client for this - it's an industry-wide reality, not a strategy failure. Lead with reach growth (which is climbing for Reels) and group-driven distribution. Pair every Facebook report with a paid amplification recommendation if budget allows.
Industry benchmarks for 2026 (Instagram, TikTok, Facebook, LinkedIn, YouTube)
LinkedIn averages around 2.0% engagement rate, with B2B niche accounts pushing 3.5%+. Posts with 2-3 personal sentences before the value beat templated copy by 4-5x. Track impressions in Page Analytics, but report on followers gained per post - that's the long-term asset.
YouTube engagement rate is harder to pin down because the platform reports it differently per format. For Shorts, treat it like TikTok (engagements ÷ views × 100) and benchmark to ~1.6%. For long-form, watch time and click-through rate matter more than ER. Always report subscriber growth alongside view counts - the latter is rented, the former is owned.
Reporting cadence: monthly, quarterly, or campaign-based?
Reporting cadence depends on the client's decision speed. Monthly is the default for retainer clients - it gives enough data to spot trends without burying the team in slide builds. Quarterly works for enterprise accounts where the strategy review is the actual product. Campaign-based reports are for product launches and limited-time pushes - show ramp-up, peak, and tail-off in one view.
The biggest reporting mistake is shipping the same template every month. Rotate one feature section per report: a deep-dive on a content pillar in month one, a top-creators benchmark in month two, an audience demographic shift in month three. The recurring KPIs stay the same; the spotlight section keeps the report from feeling like wallpaper.
Turning the report into action - the 'so what' framework
Every metric in the report needs a 'so what' line. 'Reach grew 38%' is data. 'Reach grew 38% because we doubled down on carousel posts after last month's saves analysis - recommend we hold the carousel ratio at 60%' is insight. The first prompts a renewal. The second locks one in.
Recommendations should be specific, scoped, and ranked. Three is the magic number - any more and clients can't remember them. Tie each one to an exact action with a deadline. 'Test 5 hook variations on Reels by May 15' beats 'improve content' every single time.
Free social media reporting tools vs. paid platforms
Free social media reporting tools cover 90% of what most agencies need. Native analytics (Instagram Insights, TikTok Analytics, Meta Business Suite, LinkedIn Page Analytics, YouTube Studio) give you the raw numbers. A free generator like this one packages them into a client-ready format with benchmarks, deltas, and recommendations baked in.
Paid platforms (Sprout Social, Hootsuite Analytics, Brand24, Rival IQ) start to earn their cost when you manage 10+ clients or need cross-platform competitor benchmarking. Below that volume, the cost-per-client of a $300/mo SaaS rarely pencils out - a free template plus 30 minutes of polish gets you to the same place.
The best social media report is the one that gets sent on time, every month, with a one-paragraph cover note. Cadence beats craft. Use this generator to lock in the structure, then layer your insight on top. Your future renewals will thank you.
Related free tools
Engagement Rate Calculator
Calculate engagement rate the agency way (engagements ÷ reach × 100) and benchmark against industry averages.
Content Engagement Calculator
Cross-platform engagement calculator covering Instagram, TikTok, YouTube, LinkedIn, Facebook, and Twitter with 2026 benchmarks.
Free CRM Template
Free CRM template for Excel, Google Sheets, and Notion. Pre-built deal stages, follow-ups, and notes.
Frequently Asked Questions
What is a social media report generator?
Which platforms does this report generator support?
Where do I get the numbers to fill in?
What's the agency-standard formula for engagement rate?
What are good engagement rates by platform in 2026?
Can I export the report as PDF?
Is there a Google Sheets template?
How often should I send a social media report?
Does this tool save my data?
Can I white-label this for my agency?
Stop building reports from scratch every month.
Inflowave automates social media reporting across unlimited accounts - pulled live, white-labeled, scheduled to your client's inbox.
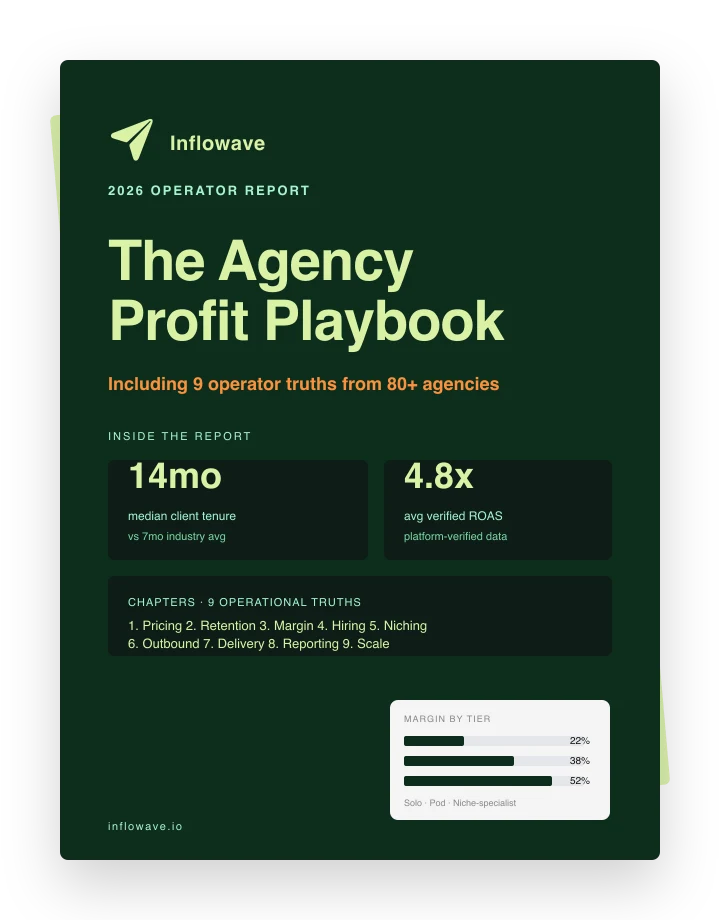
The Agency Profit Playbook Is In
How do 80+ agency operators rate their own pricing, retention, and margin? The Agency Profit Playbook has the benchmarks.