Cold DM benchmarks are usually quoted with no sample behind them. "Expect 10-20%"
gets repeated until it sounds like a fact. We run the platform these messages are
sent from, so we can check.
This is what 63,286 cold opener DMs, sent by 100 Instagram accounts across 36
agencies between June 2024 and June 2026, actually look like.
Every number below is measured, and where a measurement is unreliable we say so
and leave the claim out rather than round it into something quotable.
Instagram cold DM benchmarks: the short version
- The pooled reply rate is 15.7%. That is the number a benchmark article
would print. - The median sending account gets 2.9%. Cold DM results are concentrated in
a handful of senders. Most accounts do far worse than the average implies. - Short openers win, consistently. Accounts replying above 10% average
194 characters. Accounts under 3% average 481 characters. - 83% of replies arrive within 24 hours, and 42% within the first hour. If
nothing lands on day one, it usually never does. - Answering slowly kills conversations, and it is not just automation. Among
replies a human typed, answering within five minutes kept 87.4% of
conversations alive; answering after a day kept 55.8%. - We could not measure conversion to closed deals, and we explain why below
rather than publishing a number we do not trust.
How the reply rate was measured, and why the number moved
This matters more than the number, because it is where most benchmark content
quietly goes wrong.
Our schema carries a response_received flag on every opener. Reading it gives a
reply rate of 13.25%. That is the easy number to publish.
It is also wrong. Measuring the same thing independently - did any inbound
message arrive in that conversation after the opener was sent - gives 17.7%.
The flag undercounts by about a third, because the code path that sets it does
not always fire.
Then a third correction. 2,823 of those openers sit in conversations with no
sending account attached, and they reply at 60.4%. That is not cold outreach
behaviour; those threads are almost certainly inbound-originated or test data.
Excluding them gives the figure we actually stand behind:
15.7% of cold opener DMs get a reply.
Three defensible methods, three different answers, spanning 13.25% to 17.7%. Any
benchmark quoted without its definition is worth very little, including ours if
we had not shown the working.
Why the average cold DM reply rate hides the real story
A 15.7% pooled reply rate sounds healthy. It is not what a typical sender
experiences.
Broken down per sending account, among accounts that sent at least 100 openers:
| Reply rate tier | Accounts | Openers sent |
|---|---|---|
| 10% or better | 15 | 4,412 |
| 3-10% | 22 | 10,428 |
| Under 3% | 63 | 21,598 |
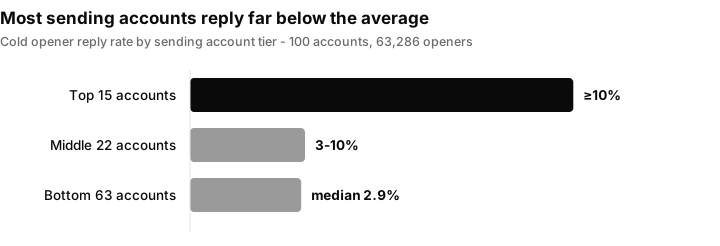
Sixty-three of the 100 accounts reply below 3%. The median account sits at
2.9%. The pooled 15.7% is carried by a minority of senders doing genuinely well
while most send into silence.
If you have run cold DM and found it disappointing, you were not doing it
unusually badly. You were in the majority.
What separates the top-performing cold DM accounts
The one variable that separates tiers cleanly is message length.
| Reply rate tier | Accounts | Average opener length |
|---|---|---|
| 10% or better | 15 | 194 characters |
| 3-10% | 22 | 329 characters |
| Under 3% | 63 | 481 characters |
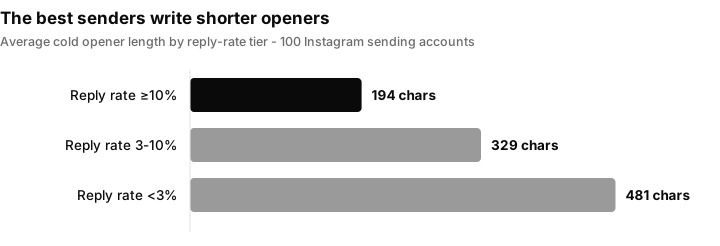
A clean gradient across 100 accounts. The best-performing senders write openers
roughly two and a half times shorter than the worst.
194 characters is about two sentences. 481 is a paragraph - a pitch. The pattern
is consistent with something obvious once stated: on Instagram, a long unsolicited
message reads as a sales blast before it is read as anything else.
What we are not claiming. We looked at send volume too, and it does not
separate the tiers - the top tier averages 294 openers per account, the middle
474, the bottom 343. There is no clean relationship, so we are not going to tell
you that sending less improves your reply rate. We also could not measure whether
top performers personalise more, because personalisation tokens make effectively
every message textually unique; the metric cannot distinguish a merged template
from real research.
When Instagram DM replies actually arrive
Of the openers that got a reply:
| Window | Share of all replies |
|---|---|
| Within 1 hour | 42.2% |
| Within 24 hours | 83.1% |
| Within 72 hours | 92.3% |
Two practical consequences.
Staffing. Nearly half of everyone who will ever reply does so within the
hour. A reply that sits unanswered overnight is answered into a conversation the
prospect has already moved on from.
Measurement. You can read a cold DM test at 72 hours. Waiting two weeks to
"let the data mature" adds about 8% more replies and delays every decision.
Speed to lead: what answering slowly actually costs
The opener gets the reply. What happens next decides whether there is a
conversation at all.
We measured every point where a lead sent a message and the business answered it
- 439,600 events - and then asked a simple question: did the lead write back
again after that answer? A conversation that continues is not a closed deal,
but a conversation that stops is definitely not one.
| Business response time | Events | Lead replied again |
|---|---|---|
| Under 5 minutes | 306,187 | 96.2% |
| 5-30 minutes | 37,577 | 88.1% |
| 30-60 minutes | 17,802 | 87.0% |
| 1-4 hours | 33,669 | 86.5% |
| 4-24 hours | 31,938 | 84.2% |
| Over 24 hours | 12,427 | 76.5% |
The gradient is perfectly monotonic. Every step slower loses conversations, and
the spread from fastest to slowest is nearly 20 percentage points.
Is this just measuring automation?
It is the obvious objection. 69.7% of those responses land inside five minutes,
which is faster than any human team replies, so the top row is clearly weighted
toward automated replies. If speed only correlates with outcomes because bots are
fast, the advice "reply quicker" is worthless to a human team.
We can separate them. A subset of messages records what sent them, which lets us
split automated replies (AI agents and workflows) from ones a person typed:
| Response time | Human: lead replied again | Automated: lead replied again |
|---|---|---|
| Under 5 minutes | 87.4% | 94.4% |
| 5-60 minutes | 82.6% | 84.4% |
| 1-24 hours | 70.5% | 80.0% |
| Over 24 hours | 55.8% | 64.1% |
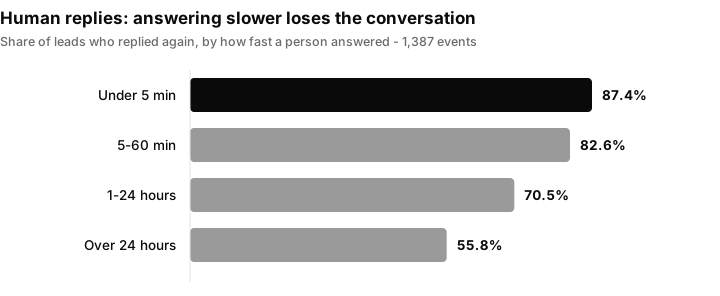
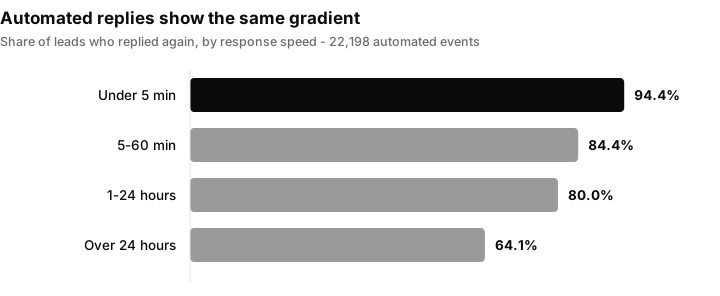
The effect is not automation. Among replies a human actually typed, answering
within five minutes keeps 87.4% of conversations alive and answering after a day
keeps 55.8% - a 31-point spread, wider than the pooled figure. The gradient is
monotonic in both columns.
Automated replies do outperform human ones at every speed, but we would not read
much into that: the conversations routed to automation are not a random sample of
conversations, and we cannot control for which ones a person chose to handle.
The human sample here is small - 1,387 classified events against 22,198 automated
- because the field identifying the sender is only populated on about a tenth of
our message history. Treat the human column as directionally solid and precisely
uncertain.
This is observational either way. A conversation that was already dying may
attract a slower reply, rather than the slow reply killing it. We are reporting a
strong, consistent association across a large sample, not proof of cause.
How this compares to the classic speed-to-lead research
Speed to lead has been studied since well before Instagram DMs existed, and our
numbers sit alongside two well-known studies - which are, for what it is worth,
almost universally misattributed.
The Harvard study. In The Short Life of Online Sales Leads
(Harvard Business Review, March 2011), James Oldroyd, Kristina McElheran and
David Elkington audited 2,241 US companies by submitting test web enquiries. The
average first response took 42 hours, and roughly a quarter of firms never
responded at all. Firms making contact within an hour were about seven times
more likely to qualify the lead than those responding an hour later, and more
than 60 times more likely than those waiting a day or more.
The MIT study - the one everyone credits to Harvard. The famous "100x" and
"21x" figures do not come from HBR. They come from the
Lead Response Management study
run by Oldroyd with InsideSales.com around 2007, analysing over 15,000 leads and
100,000 call attempts. It found that calling at 5 minutes versus 30 minutes
raised the odds of contacting a lead roughly 100-fold and the odds of qualifying
one about 21-fold. It is routinely cited as "Harvard found you must respond in 5
minutes", which is wrong on the institution, the comparison, and the framing -
the study compares 5 against 30 minutes, it does not establish a five-minute
deadline.
Where we agree, and where we differ. The direction is the same: faster is
better, and the decay is steep and early. Two differences worth stating.
First, our effect sizes are far smaller. We measure a 31-point spread in
conversation survival, not a 21-fold change in qualification odds. That is partly
a different outcome measure and partly, we suspect, that a 100x multiplier is
what you get from a small sample of B2B phone leads rather than a general law.
Second, the channel matters. Those studies concern web-form leads followed up by
phone, where a response is an interruption. An Instagram DM reply lands in a
thread the person opened themselves, which is a materially easier conversation to
re-enter - and our numbers, showing majority conversation survival even after 24
hours, are consistent with that being a more forgiving channel than a cold call.
We would treat the older multipliers as directional rather than transferable.
They are vendor-adjacent, drawn from one platform's customer base, and now nearly
two decades old. So is ours, on the first two counts.
The practical reading is unchanged either way: the cost of a slow reply is not
that the lead is annoyed, it is that the conversation quietly stops. Combined
with the finding above that 42% of cold replies arrive within an hour of the
opener, the window that matters is much shorter than most outbound teams staff
for.
Why there is no conversion number in this article
You would expect a study like this to end with a close rate. We are not
publishing one, and the reason is instructive.
We can trace cold-DMed leads into the CRM: 49,427 of them, of which 48,352 have
an opportunity record. Of those, exactly one is marked won.
That is not a 0.002% close rate. It is a measurement artefact.
99.89% of all opportunities on the platform sit at status open, and only 23
of 68 agencies have ever moved one to won or lost. The field measures CRM
hygiene, not sales outcomes.
We could have divided one number by another and published a dramatic statistic.
It would have been meaningless, and anyone who runs outbound would know it. If
you see a cold outreach close rate quoted anywhere without an explanation of how
closed-won was determined, treat it the same way.
How to split test openers properly
The distribution above has a direct consequence for testing: at these reply
rates, most cold DM tests are underpowered and read as noise.
To detect a real difference between two openers at 95% confidence and 80% power,
you need roughly:
| Your current reply rate | Lift you want to detect | Sends per variant |
|---|---|---|
| 15% | +5 points (15% to 20%) | ~910 |
| 15% | +2 points (15% to 17%) | ~5,300 |
| 3% | +1.5 points (3% to 4.5%) | ~2,500 |
| 3% | +1 point (3% to 4%) | ~5,300 |
Sending 100 DMs of variant A and 100 of variant B tells you nothing. At a 3%
baseline you would expect 3 replies against 4 - a difference that is pure chance.
This is the single most common mistake in outbound testing, and it is why teams
churn through openers on the basis of results that were never real.
A protocol that works at these volumes:
- Test one variable at a time. Length, opening line, or ask - not all three.
With two changes you cannot attribute the result. - Run variants concurrently, not sequentially. Week-to-week changes in list
quality and platform behaviour are larger than most opener effects. Splitting
the same list on the same days removes that. - Fix your sample size before you start, using the table above. Deciding to
stop when a variant "looks better" is how noise becomes strategy. - Read at 72 hours. 92% of replies are in by then.
- Start with length, because it is the only variable in our data that
separates good senders from bad ones. If your opener is over 400 characters,
test a 150-200 character version before testing anything else. - Judge on replies, not sends. Every account in the bottom tier here was
sending successfully. Delivery was never the problem.
Sample sizes above are for a two-proportion test at 95% confidence and 80% power.
One caveat worth stating plainly: with a median account at 2.9%, a rigorous test
needs a few thousand sends per variant. If you cannot reach that volume safely,
you are better off copying what works structurally - short, specific, one clear
ask - than running tests you cannot read.
Method and limitations
Sample. 63,286 messages flagged as cold openers and sent by the business,
June 2024 to June 2026, across 36 agency accounts and 100 Instagram sending
accounts. Per-account figures use only accounts with 100+ openers.
Reply definition. Any inbound message in the same conversation after the
opener was sent. We did not attempt to classify replies as positive or negative,
so the 15.7% includes rejections.
Aggregation. Per-account and per-agency rates are reported as medians
alongside means, because a small number of high-volume senders otherwise
dominate. Where the two diverge sharply, we say so.
Limitations, stated honestly.
- 36 agencies is a modest sample, weighted toward agencies that chose our
platform, and toward Instagram specifically. - Reply quality is unmeasured. A reply is a reply, including "no thanks".
- Conversion is unmeasured, for the reasons above.
- Follow-up sequence effects are unmeasured: the sequence field is unpopulated in
our data, so we cannot say whether a second or third touch helps. - These are observational figures, not a controlled experiment. Accounts writing
short openers may differ in other ways we cannot see, and the length
relationship should be read as a strong association rather than proof of cause.
No individual account, agency or customer is identified anywhere in this
analysis, and every figure is aggregated across multiple senders.
Sources and further reading
Prior research on response speed
- Oldroyd, J., McElheran, K. and Elkington, D. (2011). The Short Life of Online Sales Leads. Harvard Business Review, 89(3). Audit of 2,241 US firms; 42-hour average first response.
- Oldroyd, J. with InsideSales.com (c. 2007). Lead Response Management Study. Source of the widely misquoted 100x contact and 21x qualification figures; based on 15,000+ leads and 100,000+ call attempts.
Platform rules that constrain cold DM
- Instagram Community Guidelines - the policy that governs unsolicited messaging.
- Instagram Messaging API documentation - including the 24-hour messaging window, which is the reason the timing data above has practical consequences.
Our own related guides